
Appearance
Deployments
The Deployments menu is the final step in configuring Video Vision, where all the flows, dashboards, and hardware are connected and assigned.
⚠️ Warning
Only one deployment can be active at any given moment. Multiple active deployments are not currently supported.
Create a deployment
To create a deployment, follow these steps:
Click Create Deployment.
Enter a name and description to distinguish the deployment easily.
Select the relevant timezone.
(Optional) Check Enable reporting to turn on Reporting.
(Optional) Set the long-term and short-term retention periods.
Click Create.
Continue to Deployment configuration.
Configure deployment
Click Configure.
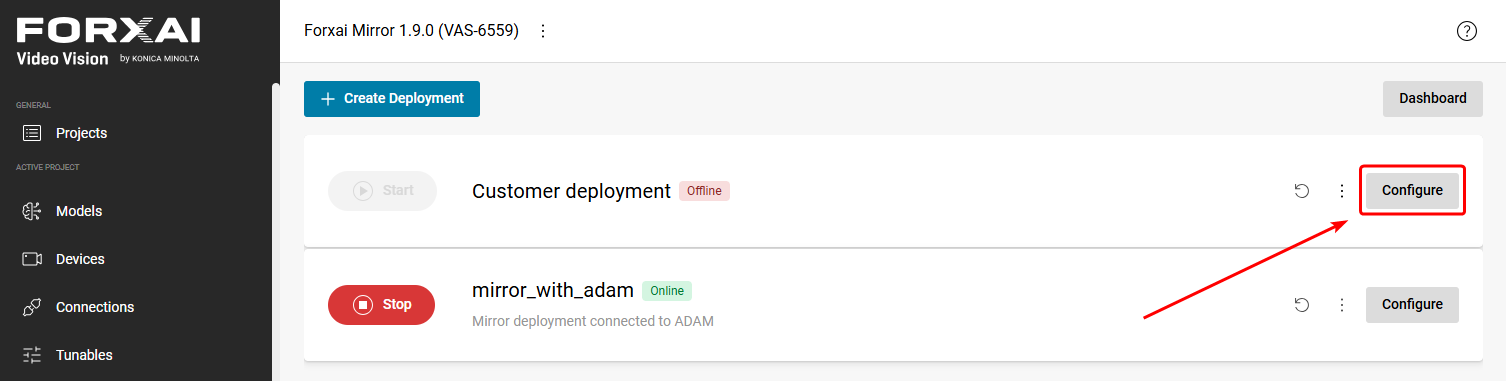
Click the ➕ button and select the flow you want to use from your created flows.
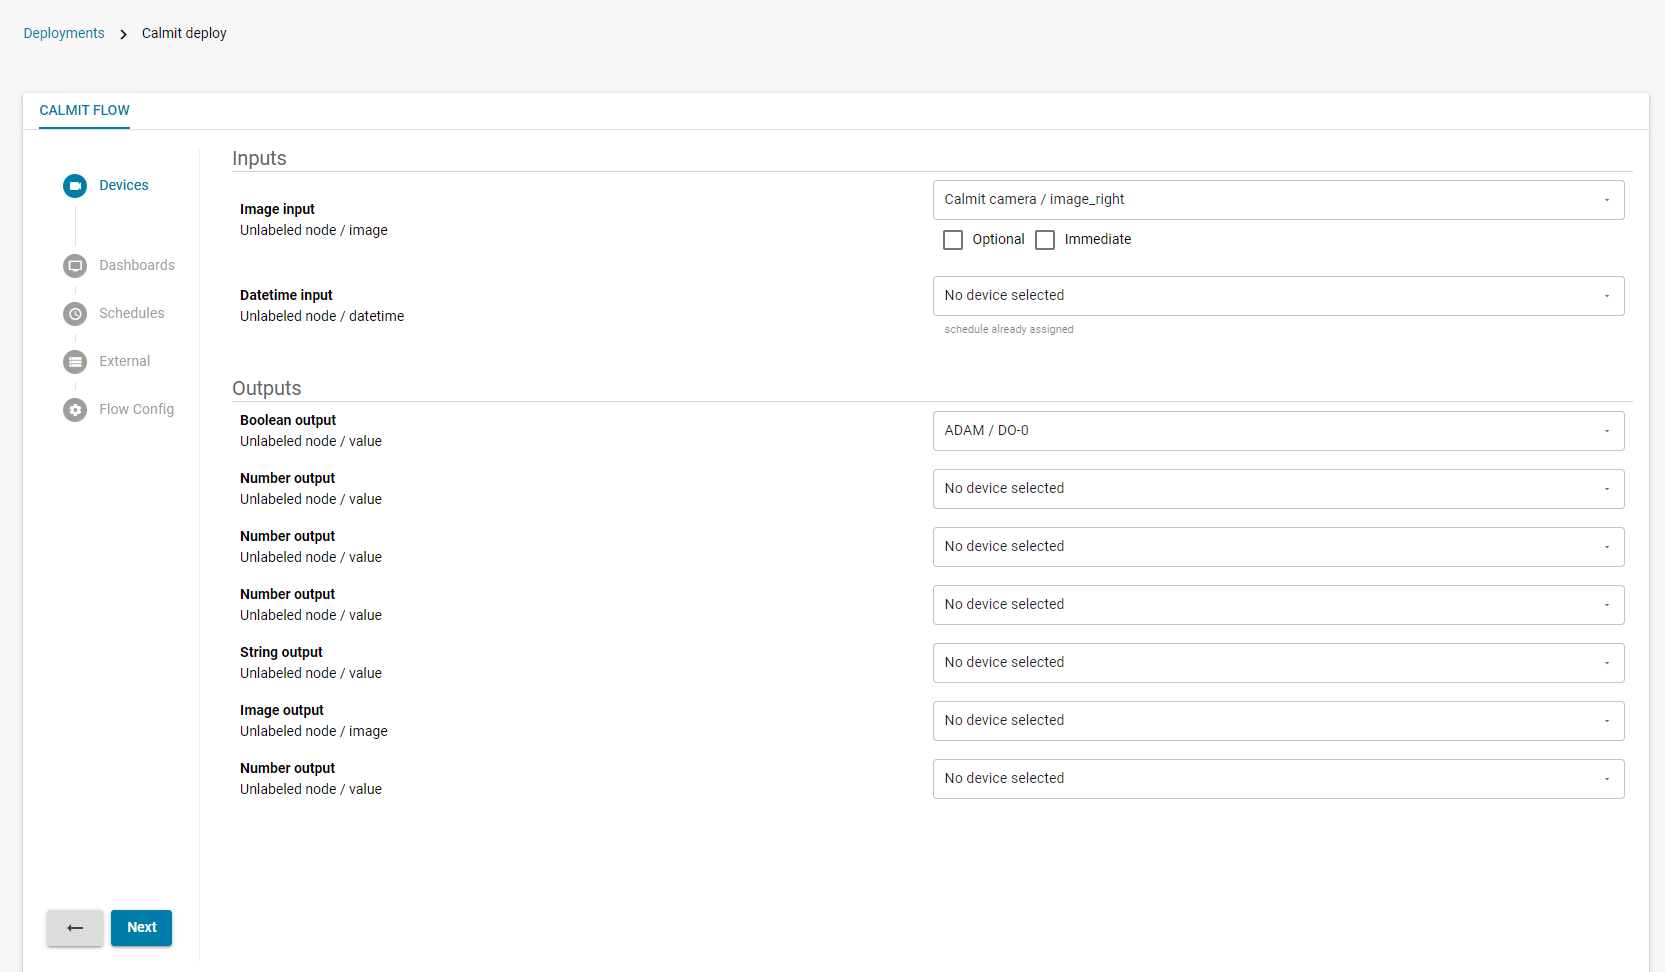
In the Devices section, assign any physical devices (e.g., cameras, I/O modules) connected to the deployment with the relevant input and output nodes, then click Next.
💡 Tip
Each device, scheduler and connection can be set to optional and immediate. See section below on Configuring I/O Options to get detailed information on how these settings affect Flows behavior.
In the Dashboards section, click Add Dashboard, then select your pre-configured dashboard, then assign the Widgets to the appropriate flow outputs (e.g., a stream widget to an image output node).
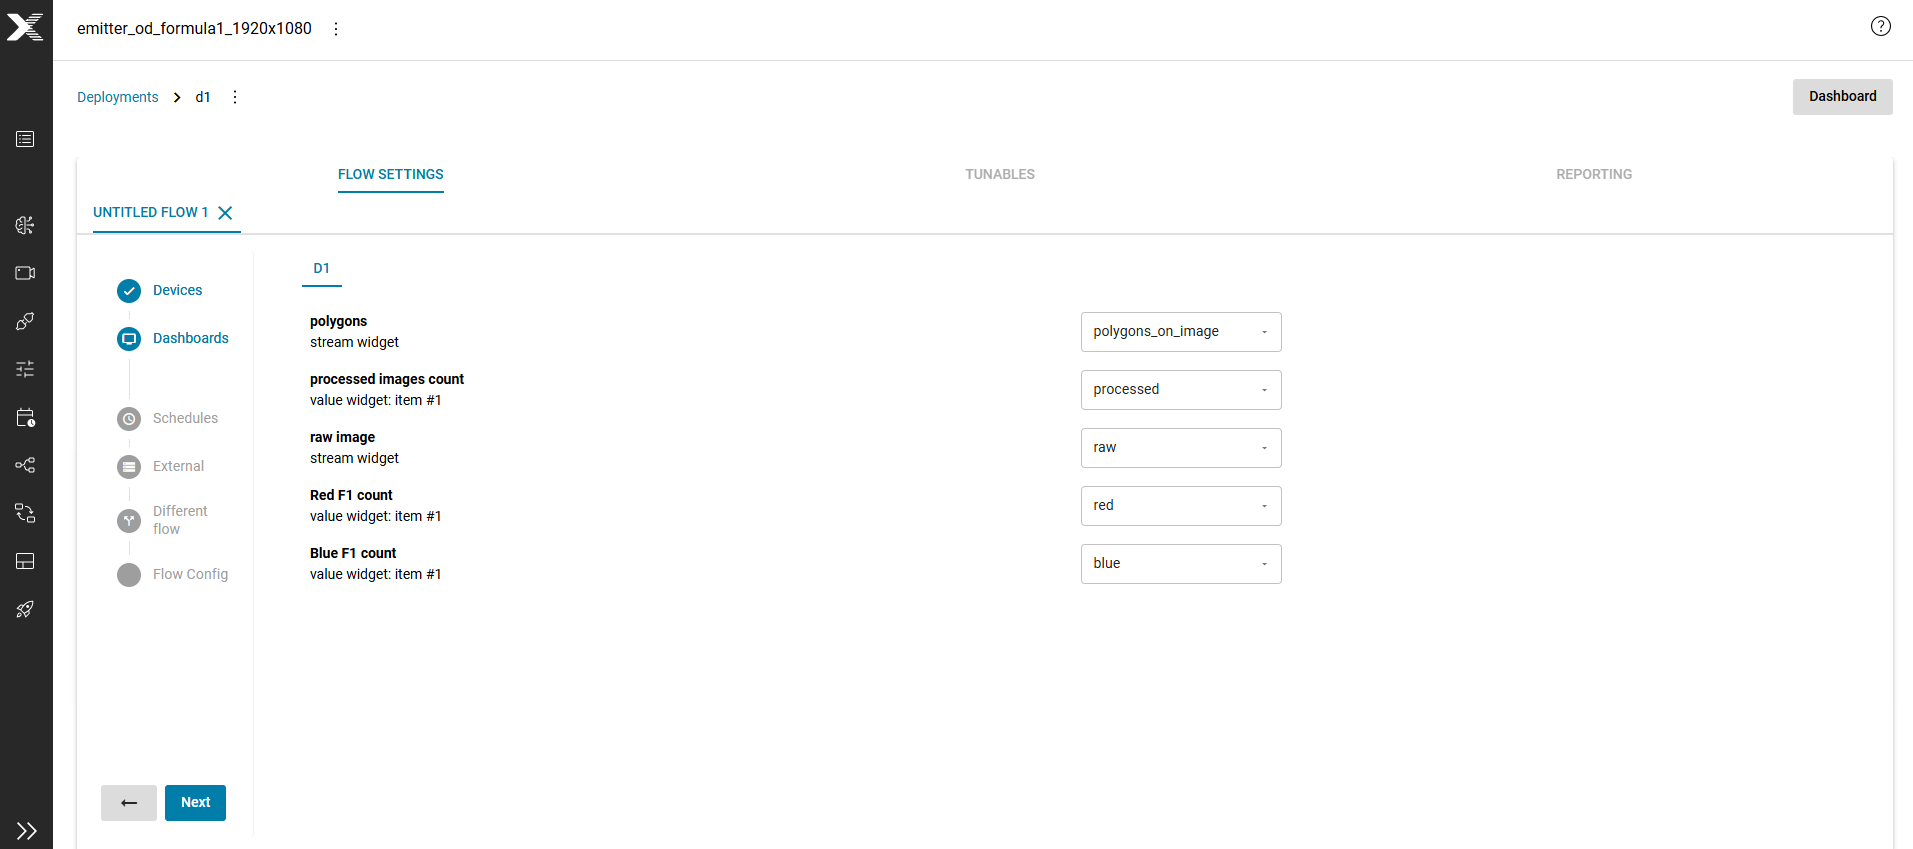
If your deployment requires multiple dashboards, repeat steps 4 and 5 until you have configured all the dashboards.
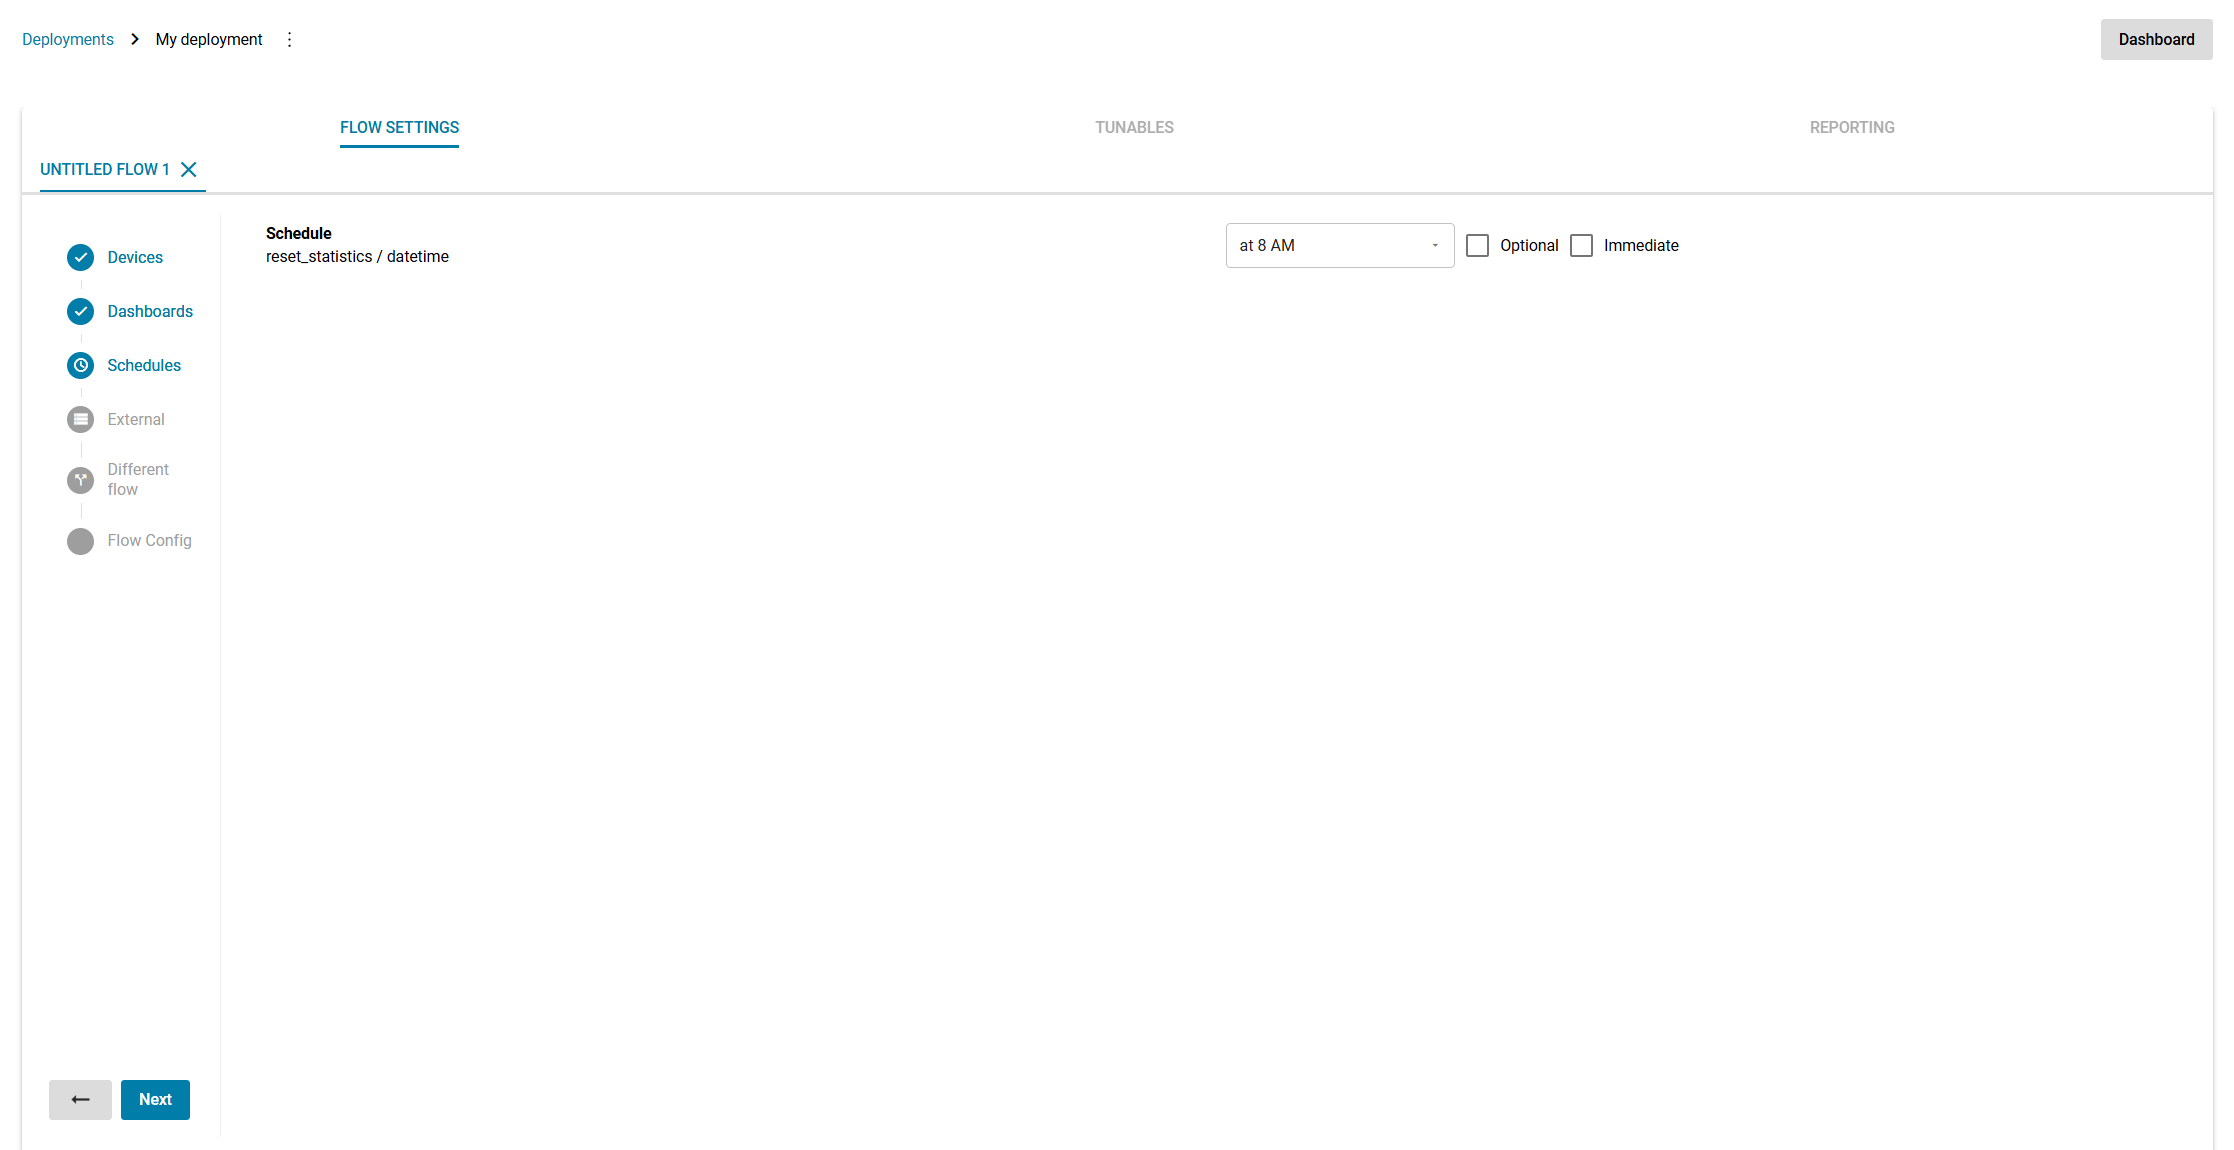
(If applicable) In the Schedules section, connect the appropriate Datetime nodes with the preset schedules. It is recommended to set schedulers to optional and immediate, then click Next.
(If applicable) In the External section, assign the appropriate input and output nodes to relevant external devices, then click Next
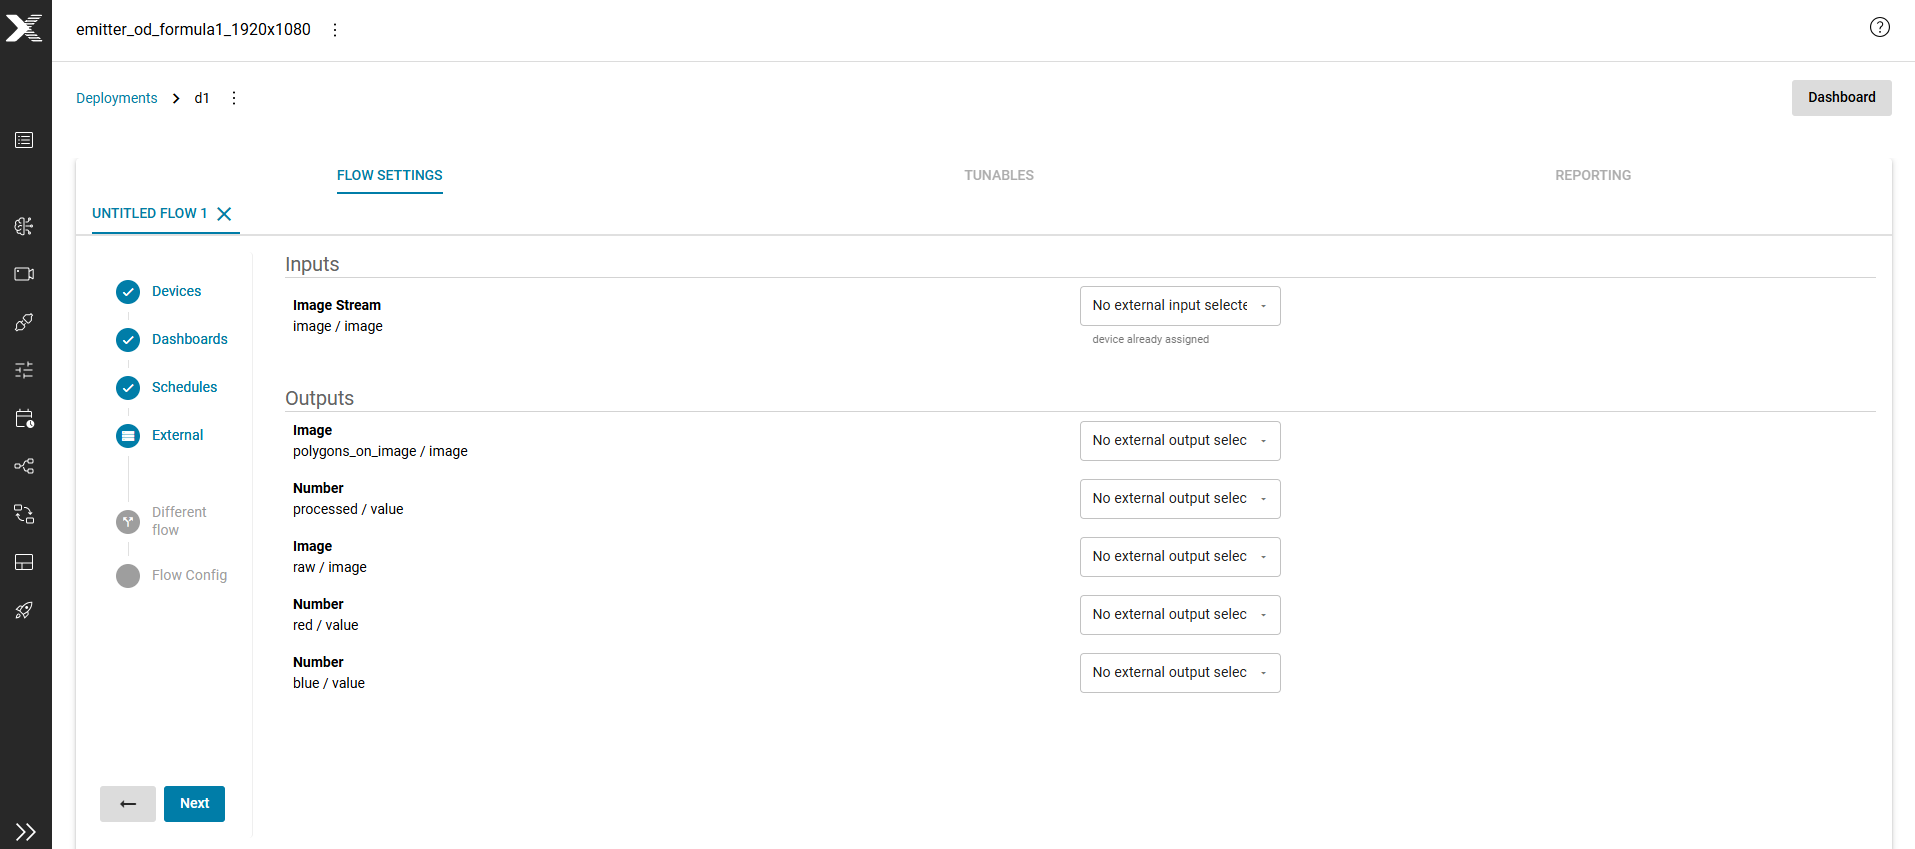
Return to the Deployments overview, then click Start to run the deployment. Running deployment is marked as Service Running.

⚠️ Warning
Deployment startup may take up to 2 minutes. First inputs will be processed once complete.
Configuring Flow Settings
This section of deployment houses some of the more advanced settings which have an impact on flow behavior as whole. See below for reference on their usage.
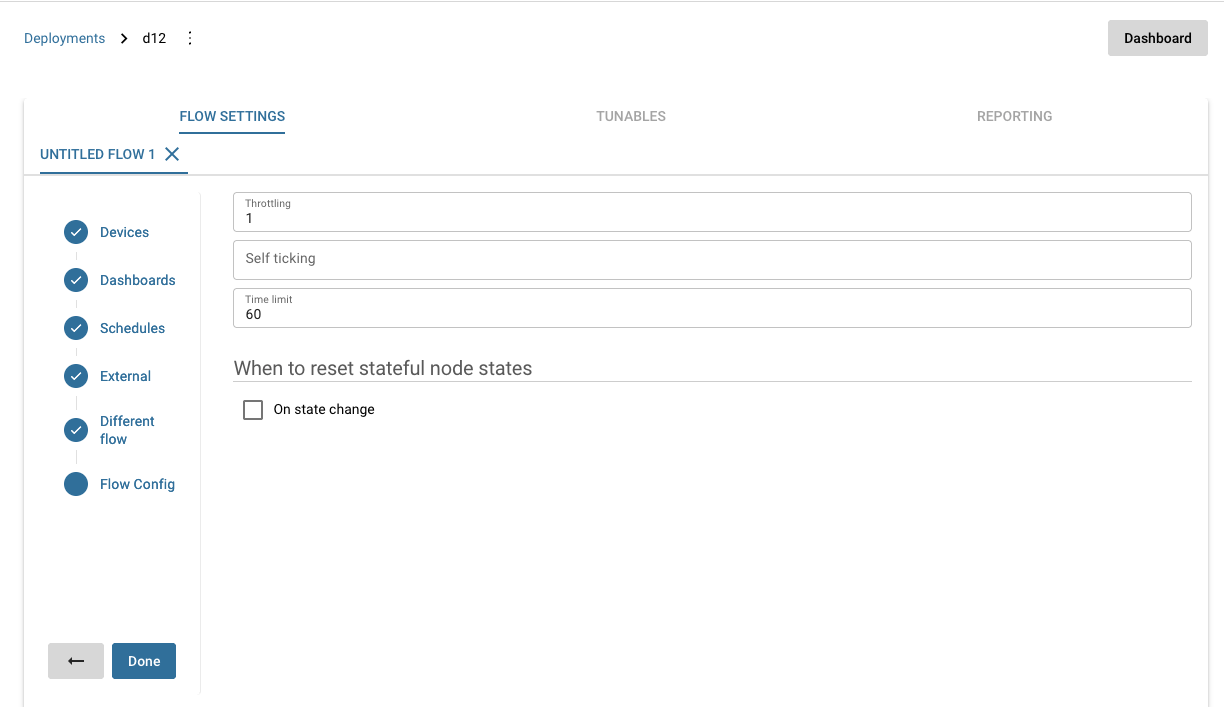
Throttling
Throttling is a mechanism that is used to ensure that application is healthy and can process data in real time. It denotes how many request can be in progress at the same time. When new requests are received by application it checks current count of request and terminates incoming request if current count is at the limit. This prevents incoming requests from piling up in the queue jamming the whole system, or increasing latency.
Increasing this limit may lead to increased performance, up to certain point where whole application will deteriorate. It is recommended to set this number to 1 or 2 requests below maximum limit, to ensure smooth experience. Dropping only few requests can be impactful if such a request aligns with reset signal of statistics for example.
Self Ticking
Self Ticking indicates frequency at which nodes within the flow are activated independently of flow inputs. This allows nodes without input such as timer to run and produce their outputs. Therefore, this works like a heartbeat for flow activating it at regular interval according to configured frequency in Hz. Default is empty - this functionality is turned off.
Time limit
This setting (in seconds) indicates maximum time that requests can be in progress before being terminated. Terminating them discards all results as if the request was never received.
Resetting stateful nodes
Enabling this setting will erase internal state for all nodes when state is changed. This allows resetting statistics - counters, based on external triggers by aligning system state with them.
Access the live dashboard
To view the live dashboard, click the Dashboard button in the top right corner.

This will give you access to the live dashboard, where you can view the configured solution and verify everything is working as intended.
⚠️ Warning
The dashboard can take up to 20 seconds to load.
💡 Tip
You can access the dashboard through the button at any time, but the content depends on the configuration of the deployment.
Configuring I/O Options
Synchronization
Engine executing flows has handler which receives values for its inputs. When these are received system attempts to join inputs together, to create one request identified by one ID. For request to start, all flow inputs (with exception of cases of immediate / optional) need to be collected withing grace period, otherwise all of these are dropped and whole requests is discarded. This means that unless using immediate and optional settings, flow can only start with all of its inputs and therefore synchronizes them based on time.
Flow contains nodes in form of oriented graph and executes them independently based on their inputs being ready for processing. To finish processing a request all flow outputs needs to be filled. If one of the nodes fails to be produce result by introducing Flow Timeout or results in error whole request is discarded. When that happens no values are passed to devices, dashboards and connections mapped to outputs.
Immediate Inputs
If any of the inputs is marked as immediate it is passed for processing without waiting for all other inputs. This is useful for processing real-time, low latency events for triggering or resetting statistics.
Optional Inputs
Setting input as optional means that flow can be started without this input being filled. This is useful when combination of stream values and discrete events is used within one flow. Triggering one input based on event would not block processing video stream from camera, such as when resetting statistics based on physical button or scheduled events.