
Appearance
Flow Builder: Count LEGO Formulas by Color
Overview
In this tutorial you will create your first working application that can process an image and detect and count objects in it, showing the results on a dashboard.
What you'll learn
- How to use
Flow Builderto create a business logic - How to use an
AI Modelnode - How tu use a
Virtual Camera - How to use a
Counternode - How to use an
Accumulatornode - How to create a dashboard to show the results
- How to start and stop a deployment
- How to show a dashboard
What you'll build
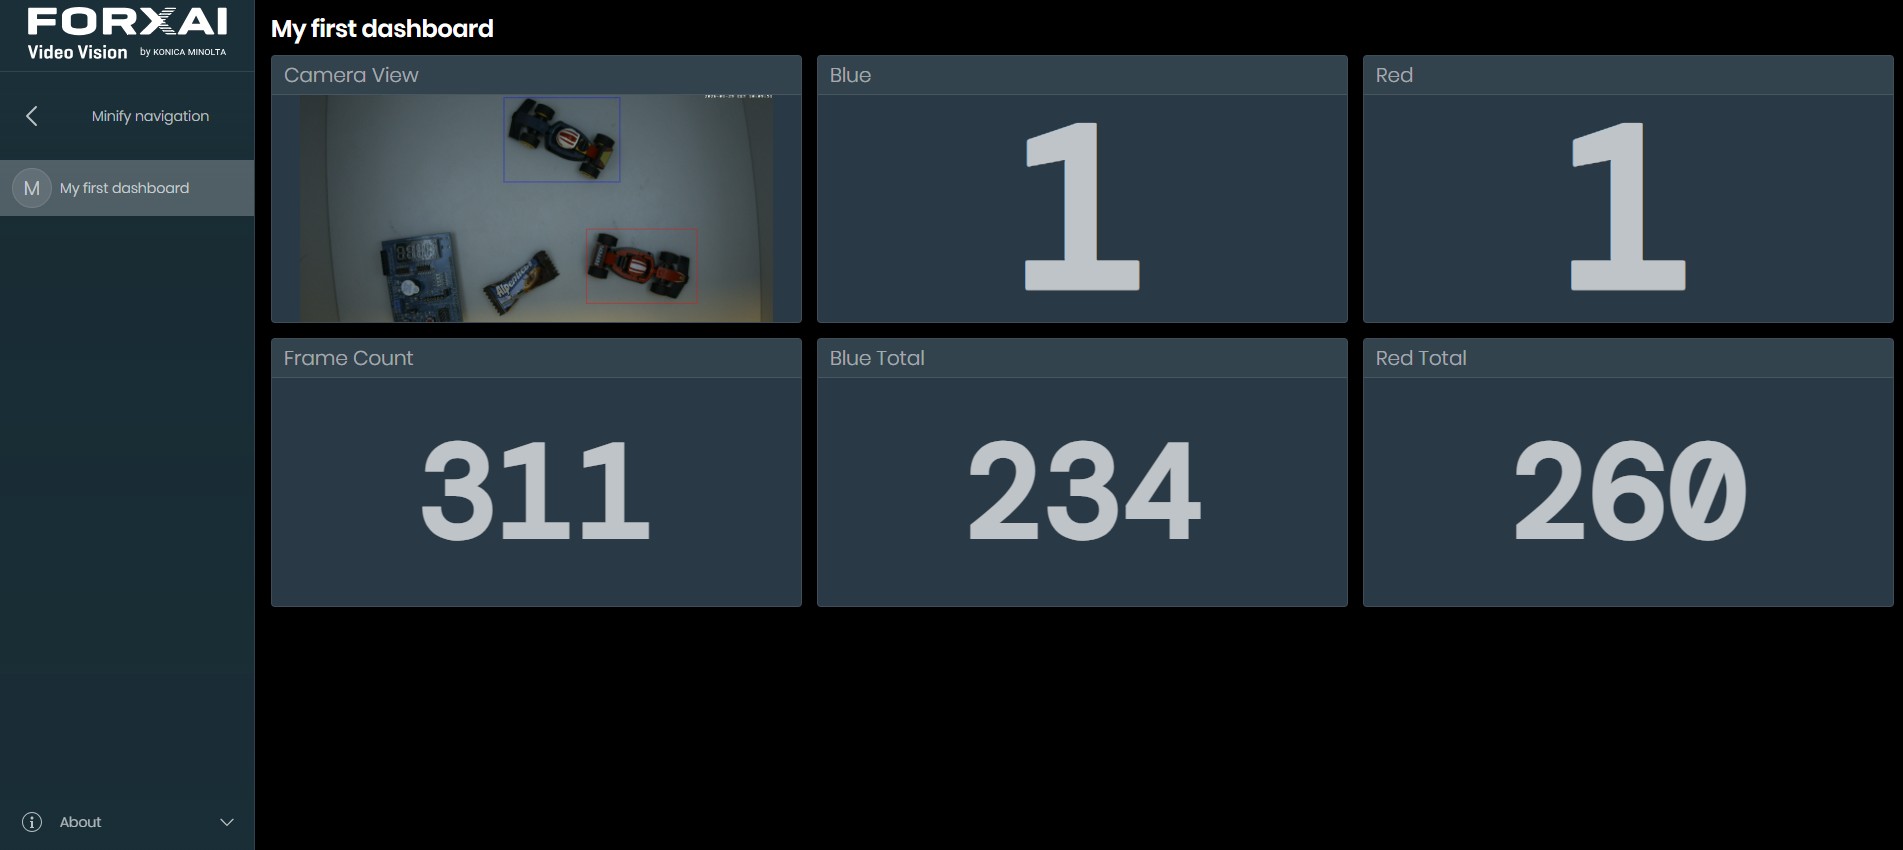
By the end of this tutorial you will have a working application that can detect objects in an image, count them and show the results on a dashboard.
Prerequisites
To complete this tutorial you wil need the following:
Required assets:
- The example image archive
emitter_od_formula1_1920x1080_dataset.zipthat you can download from here - The password for the
platformadminuser, that you received via email when you installed the platform.
To complete this tutorial, you need the platformadmin role. If you don't have this role, then you cannot create or modify business logic.
Estimated time
60 minutes
Step 1 : Create an Image Dataset
In the Hub, create a new image dataset that will be used later by the virtual camera.
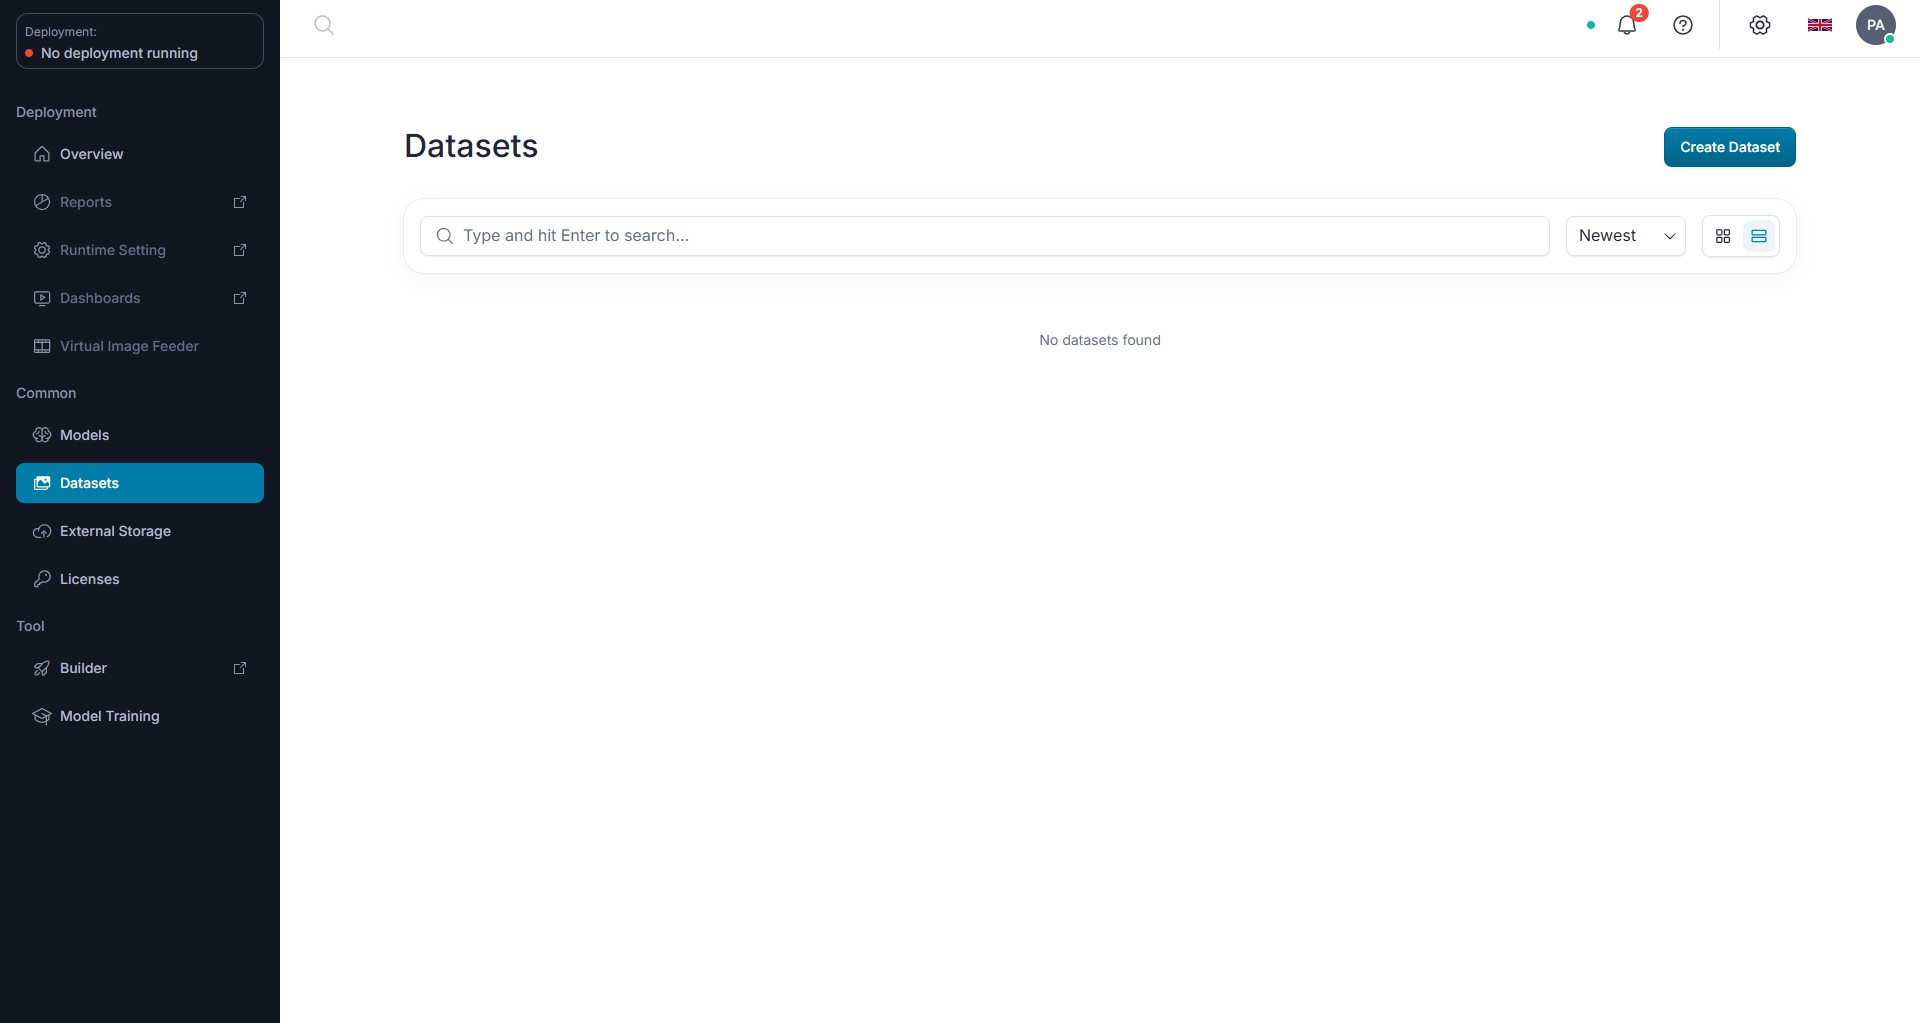
- Click on
Datasetsin the side bar. The datasets page opens.
- Click on the
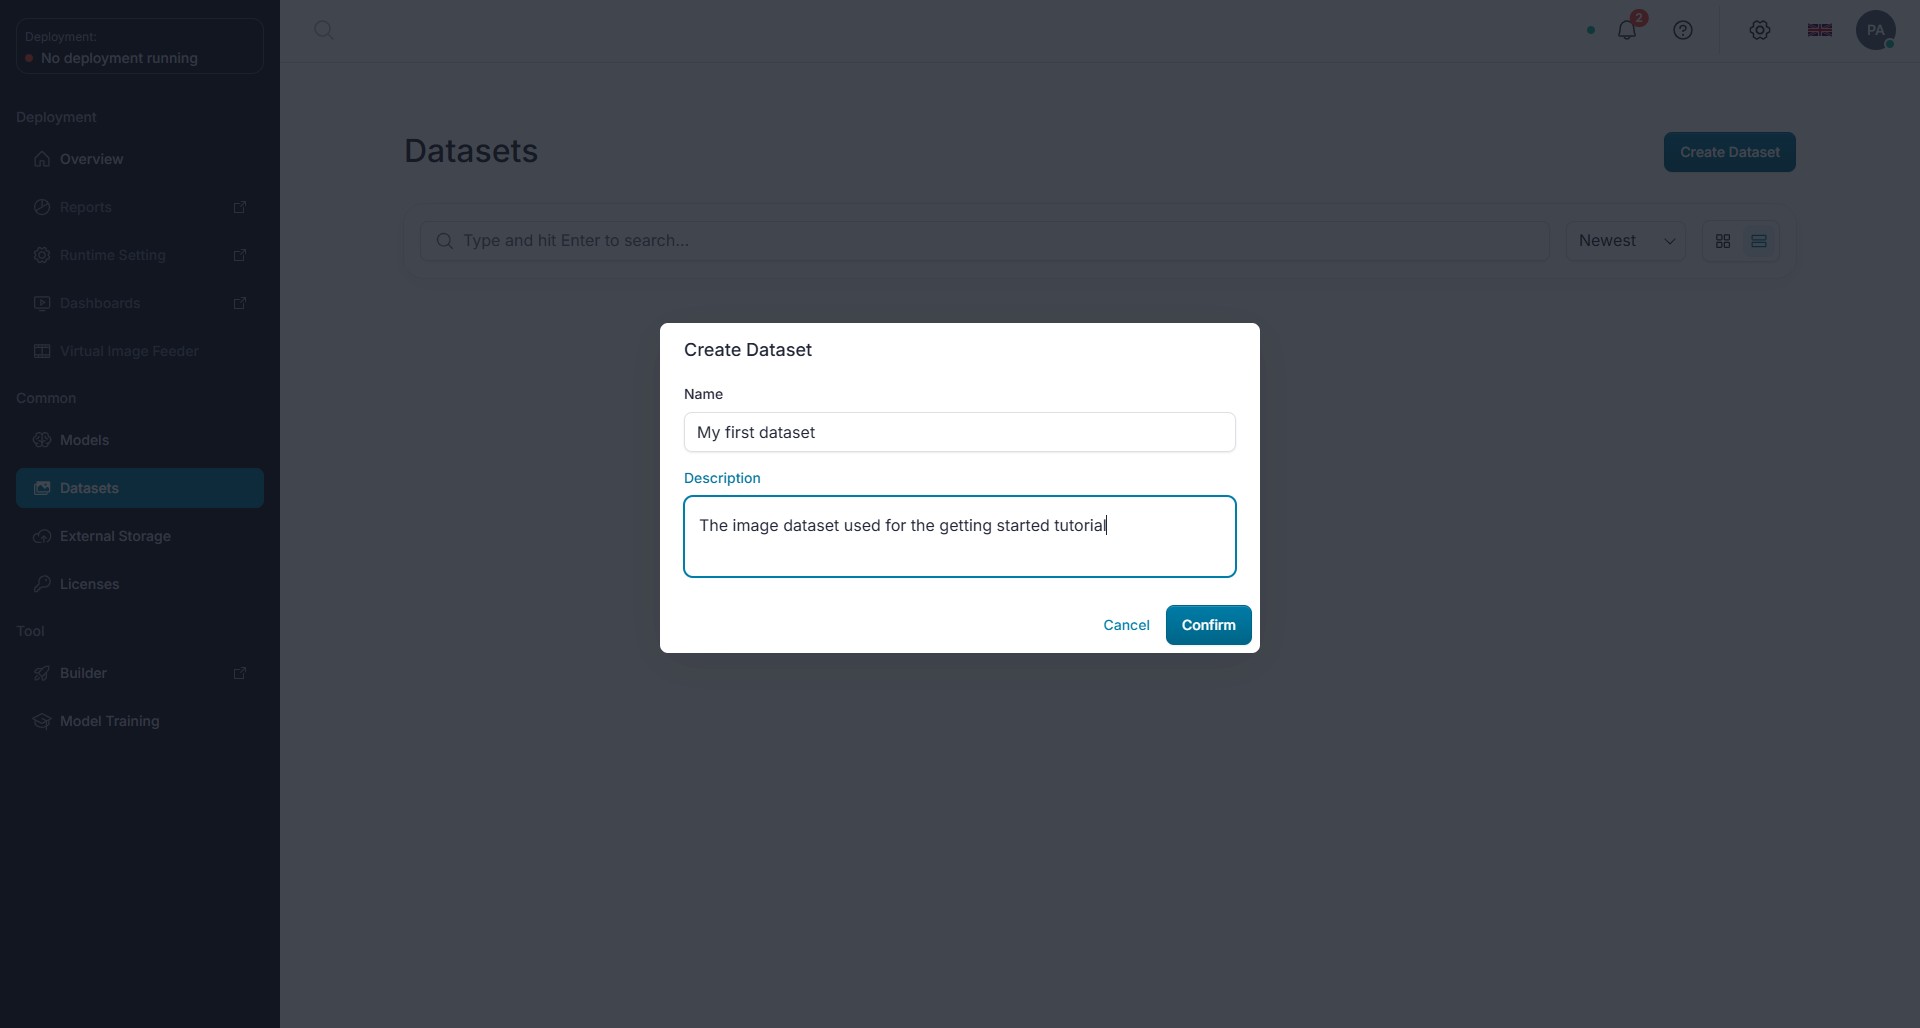
Create Datasetbutton. TheCreate Datasetdialog appears. - Type
My first datasetIn theNamefield - Optionally add a description in the
Descriptionfield
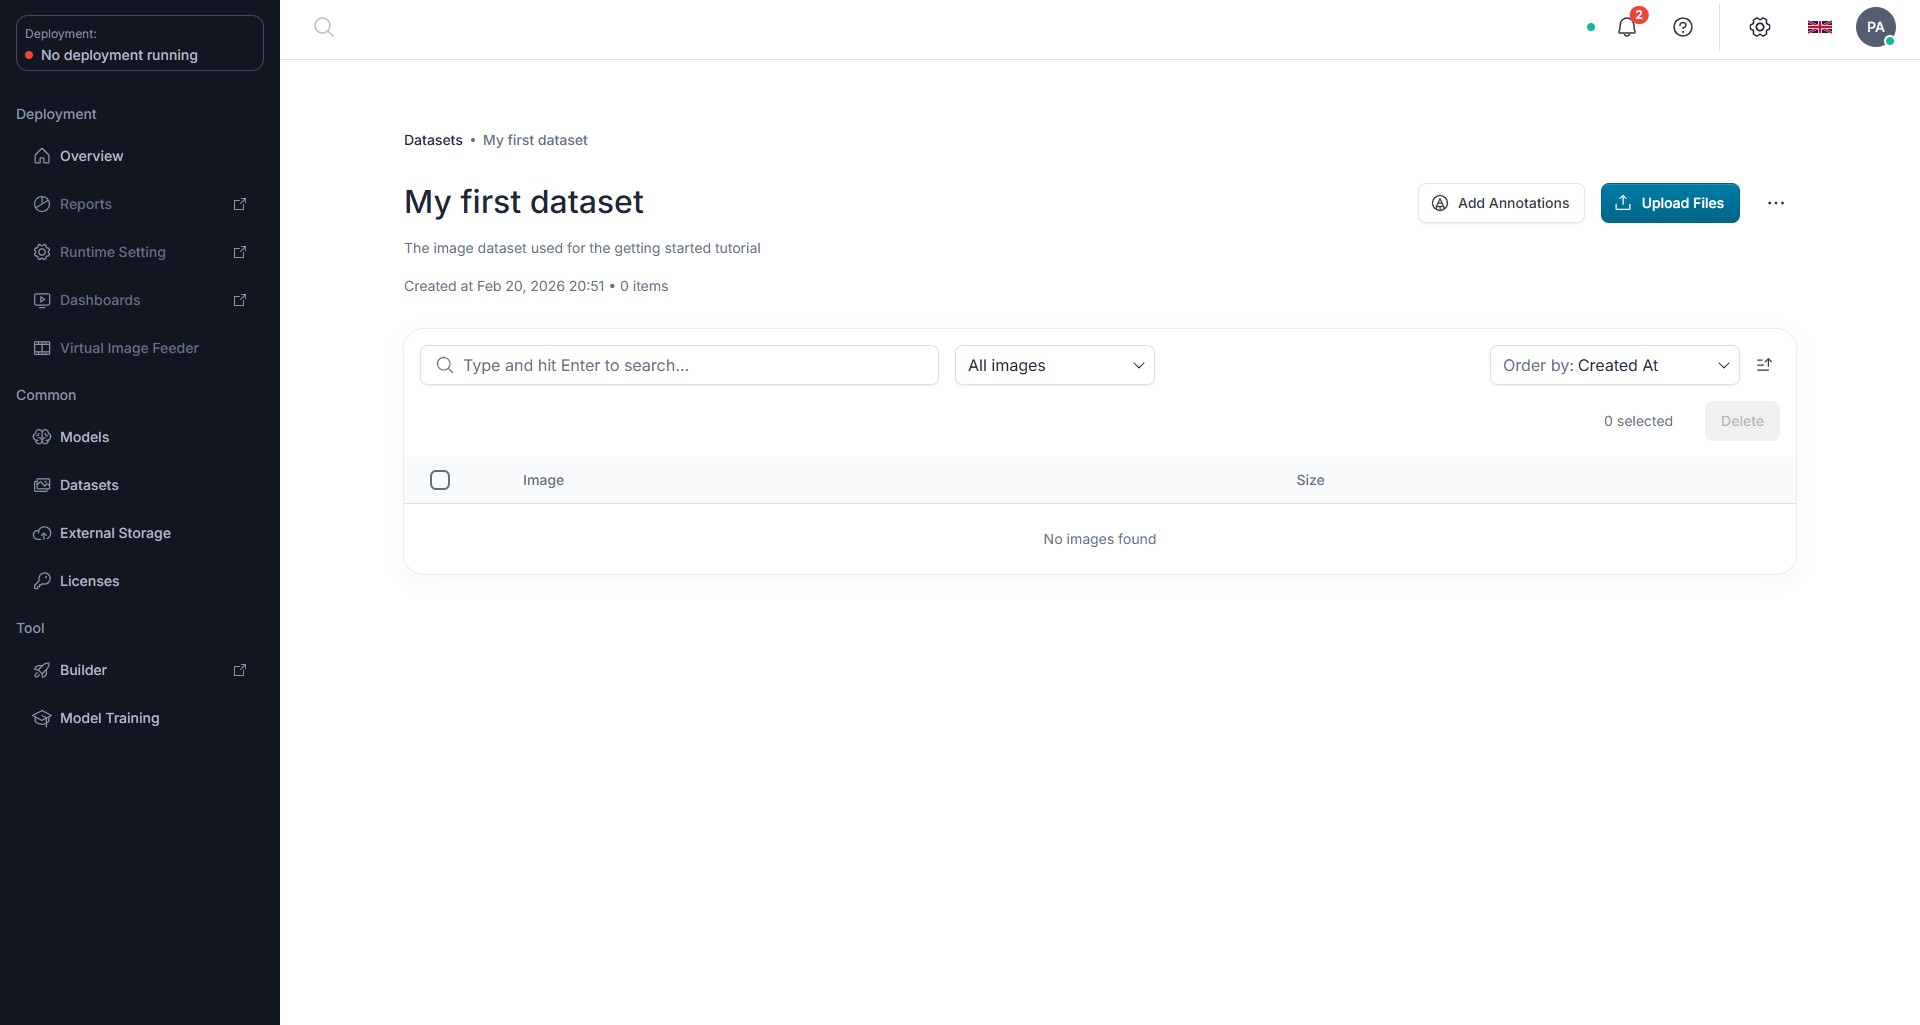
- Click on the
Confirmbutton. The empty datasetMy first datasetis shown.
- Click on the
Upload Filesbutton. TheUpload filesdialog appears.
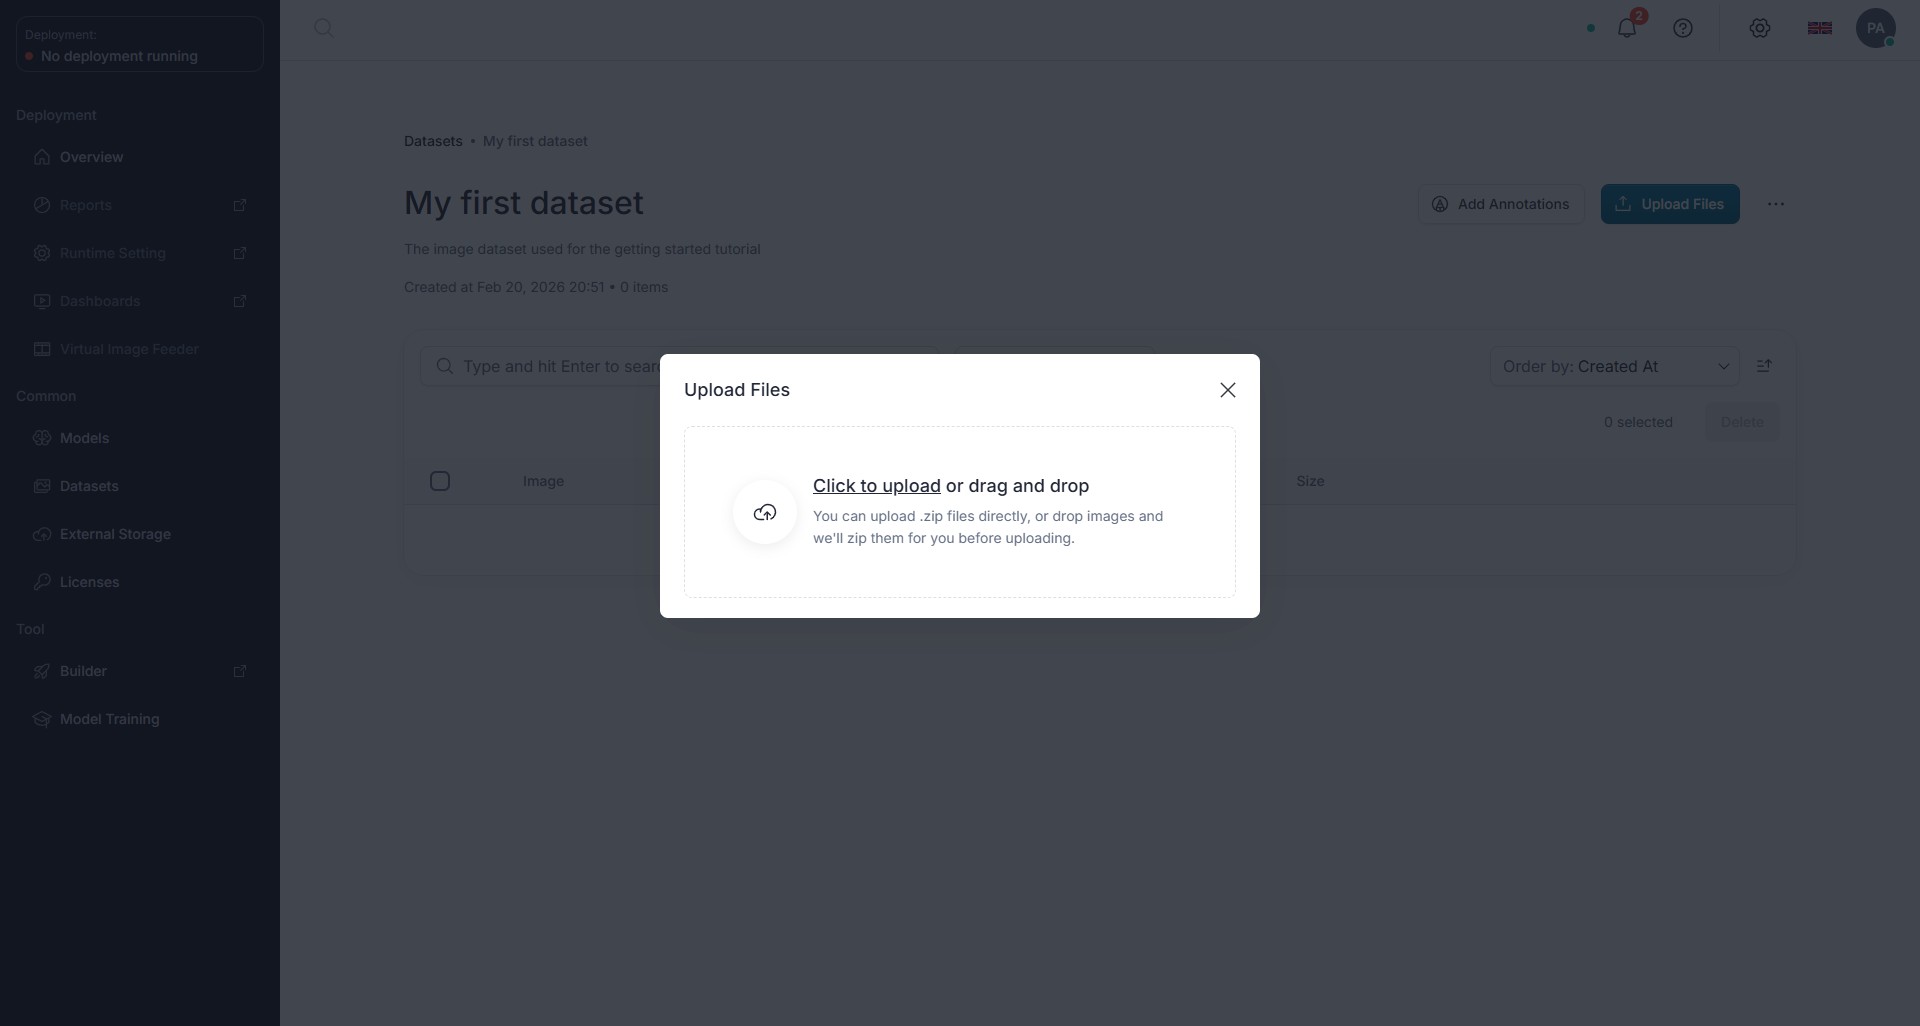
- Drag and drop the
emitter_od_formula1_1920x1080_dataset.zipfile in the dialog. The file is ready for uploding in the platform.
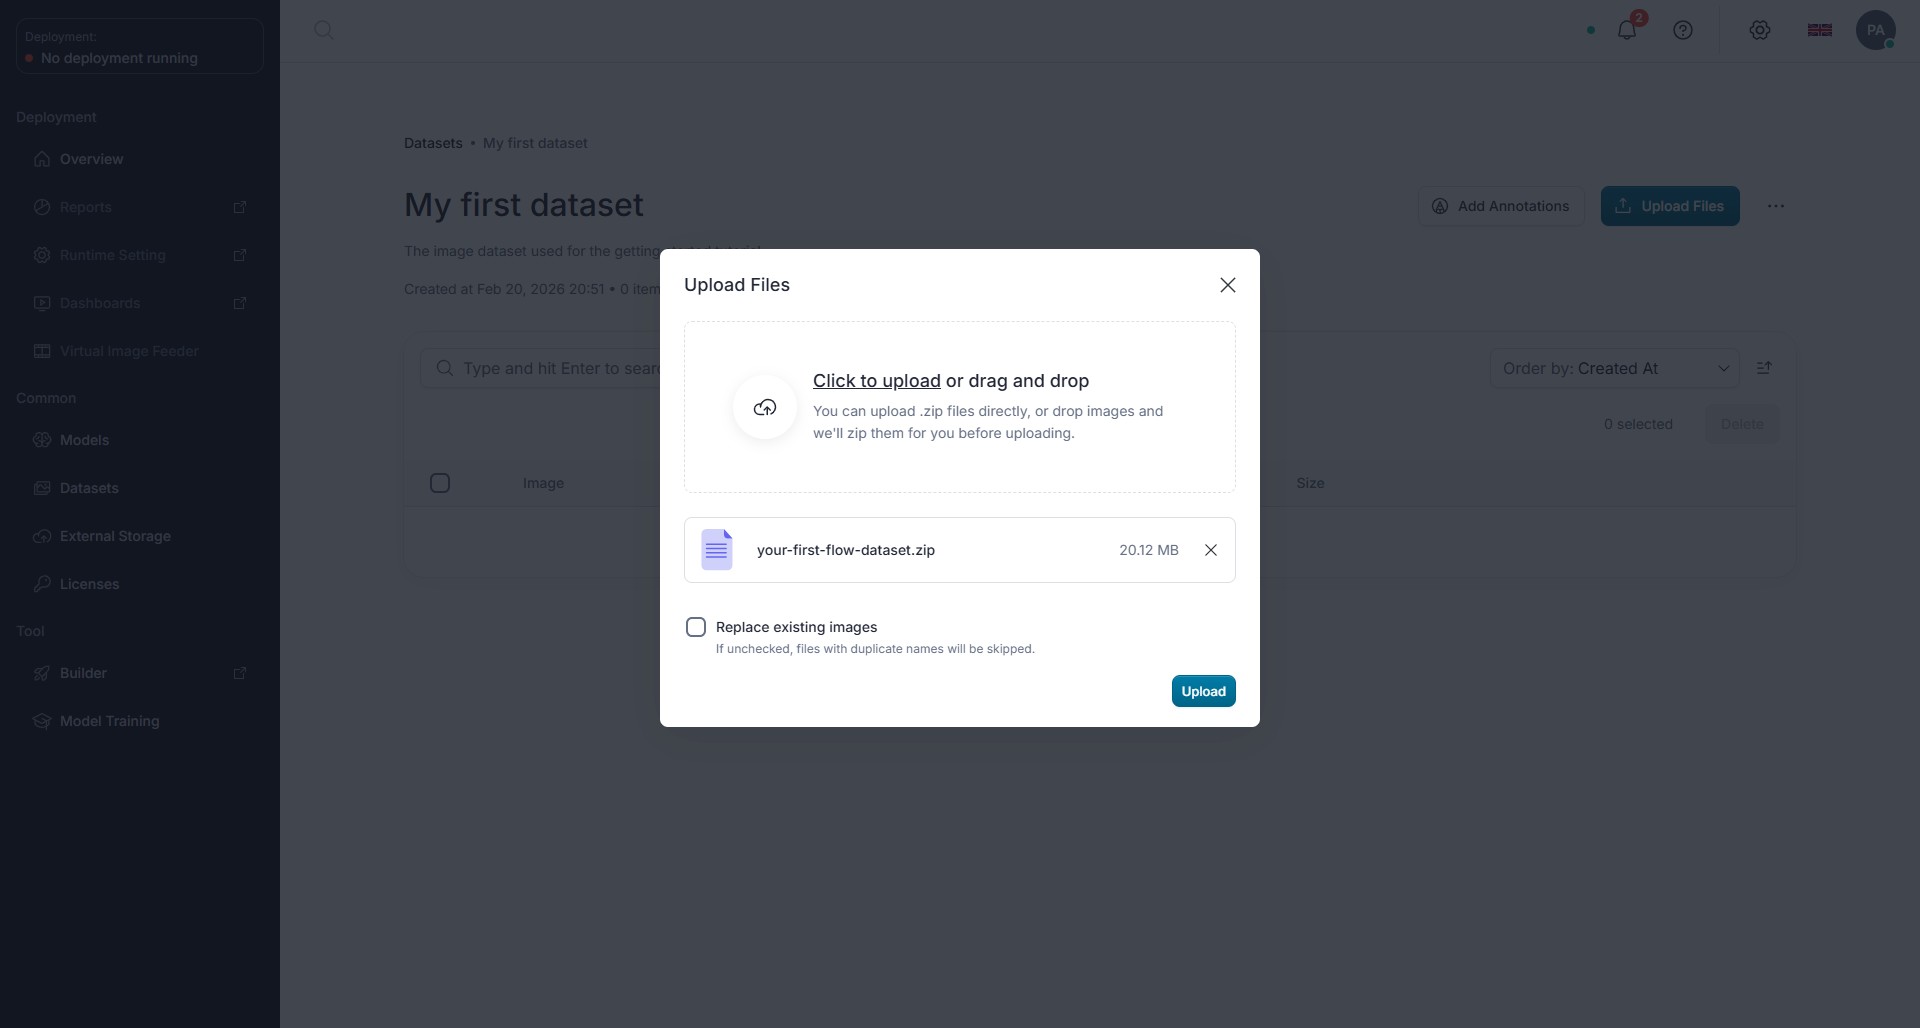
- Click the
Uploadbutton to begin the upload. - A progress bar show the uploading status
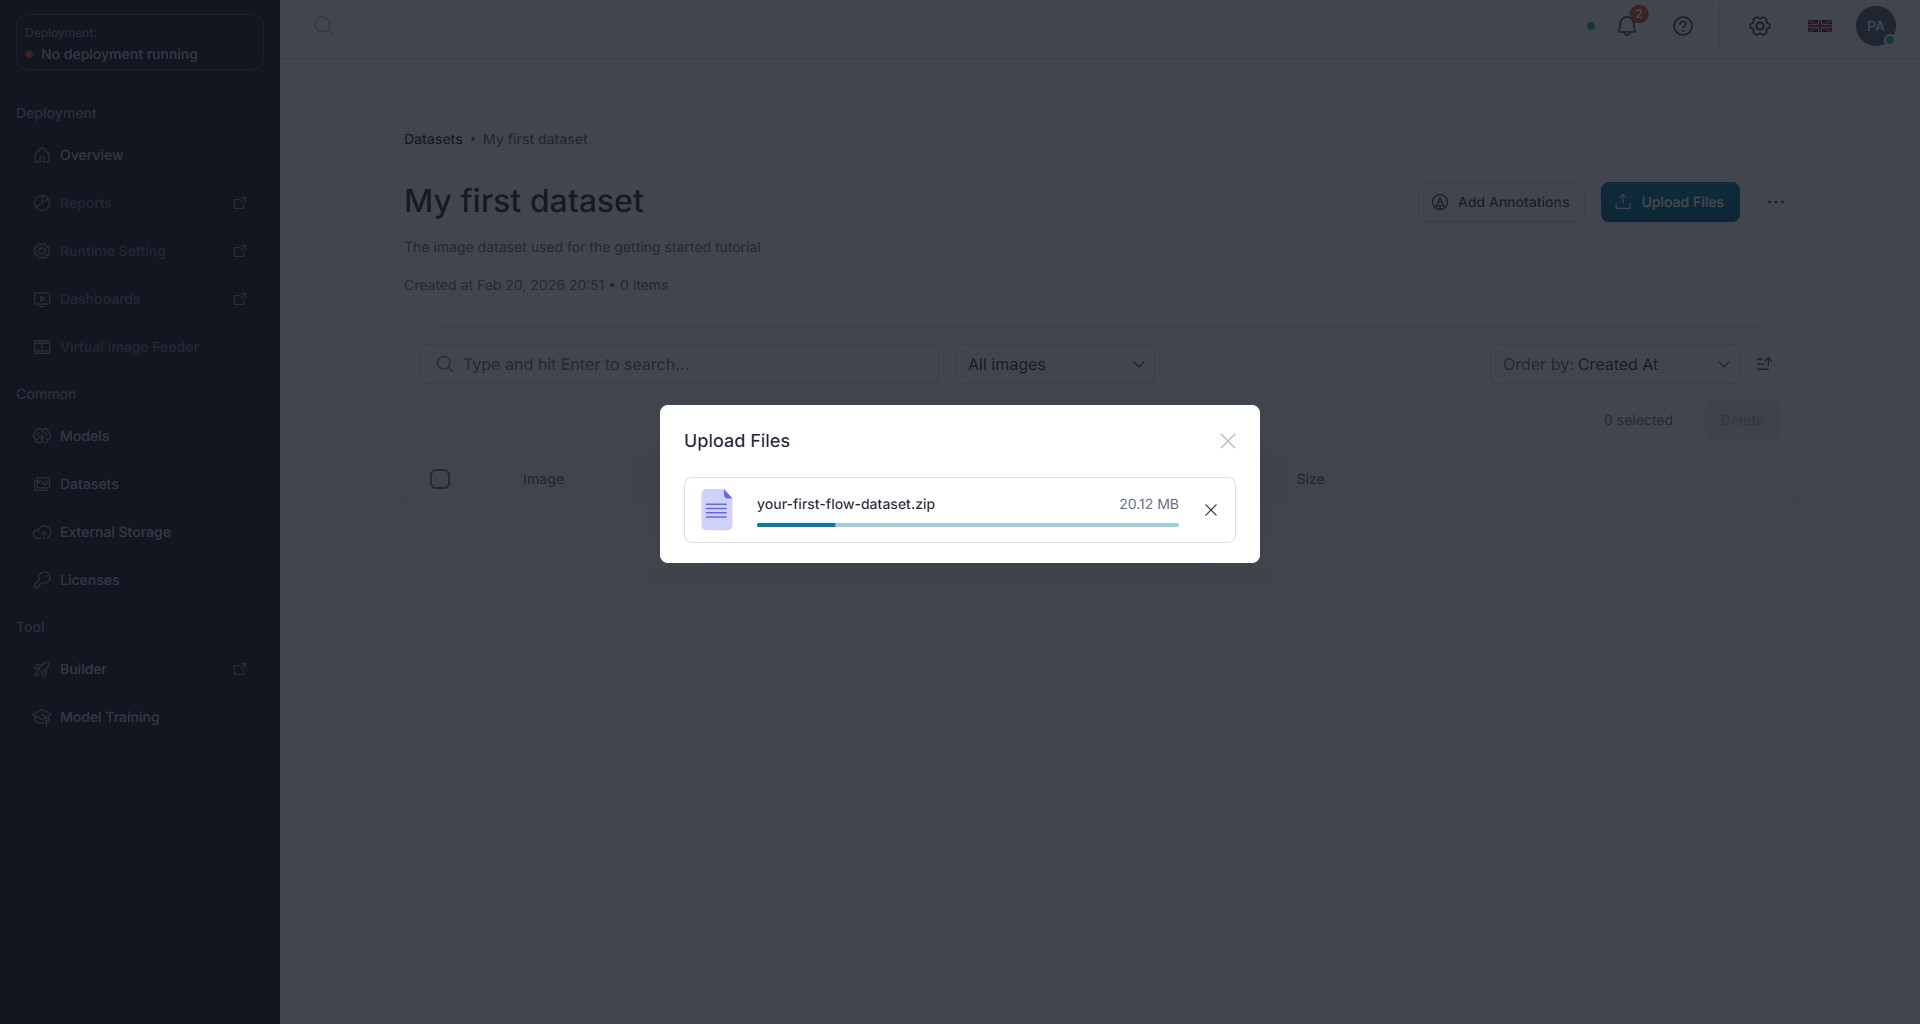
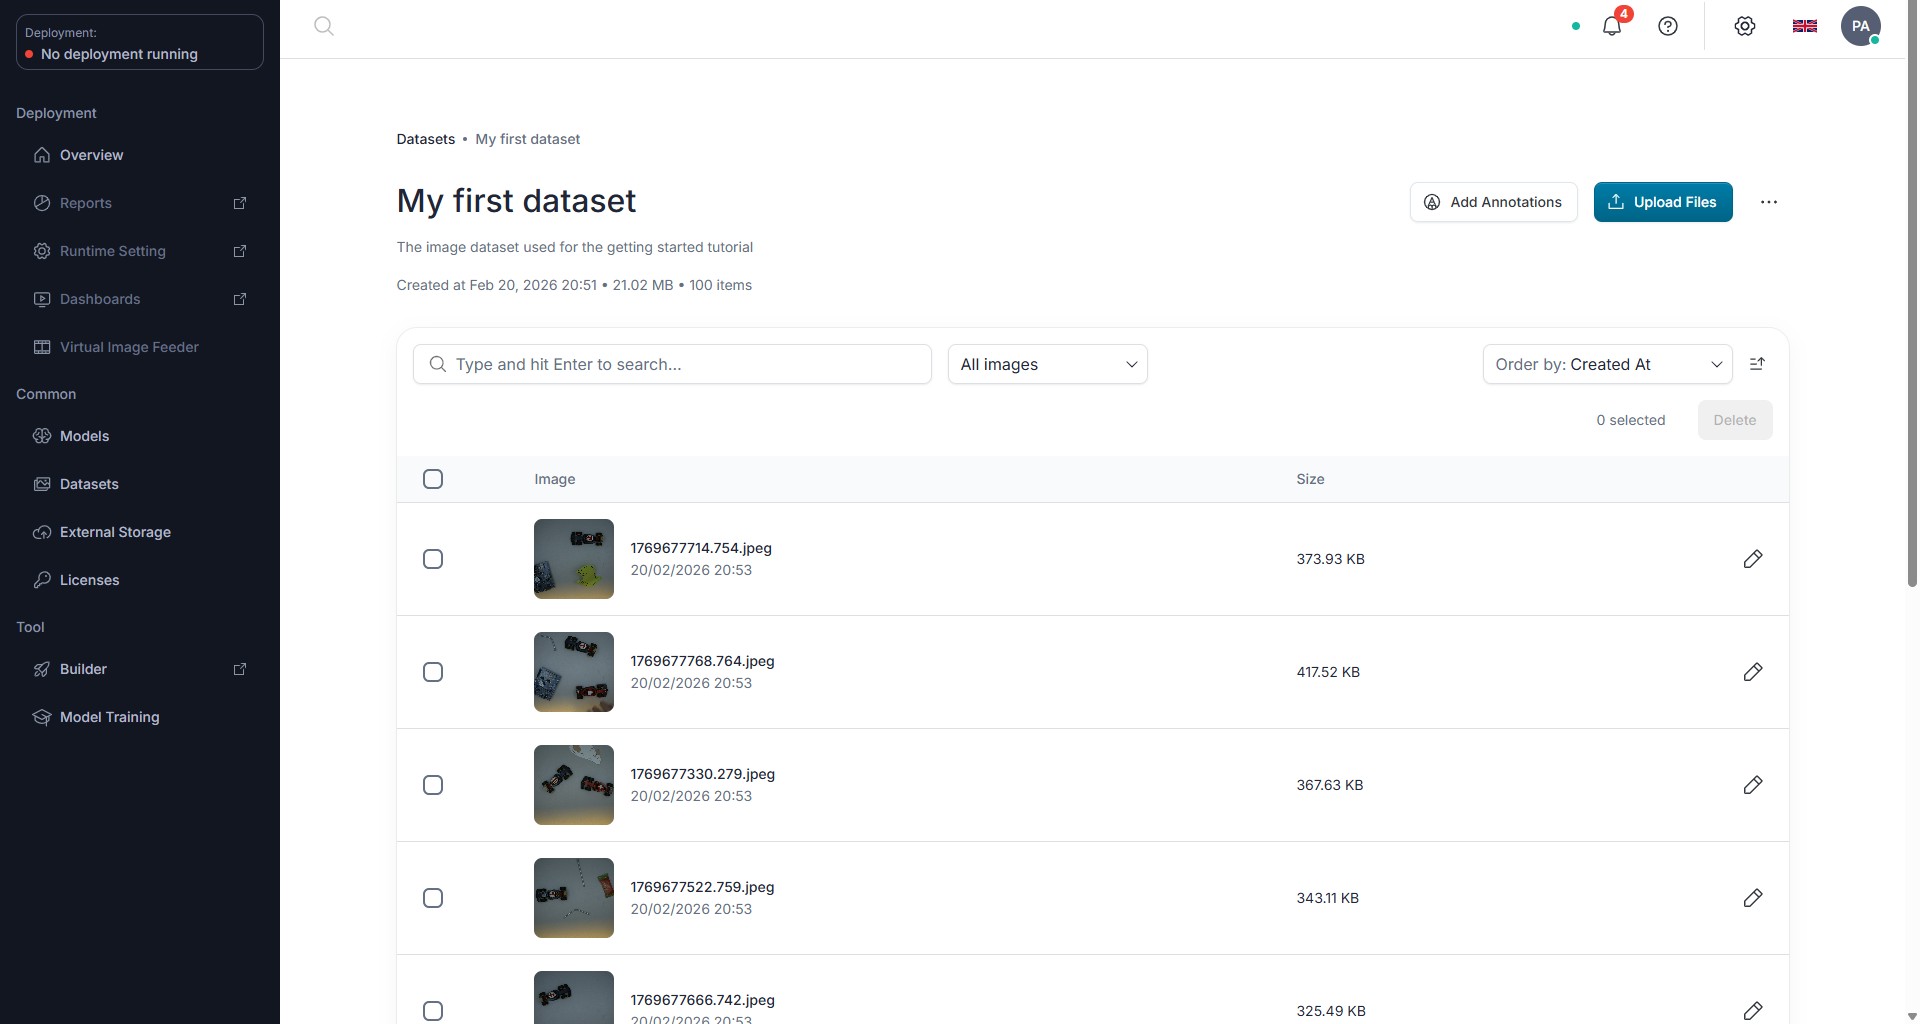
- At the end of the process, the
My first datasetpage is shown, populated with the images in the zip file.
Step 2 : Create a Dashboard
In this step you will create the dashboard to visualize the output of your business logic.
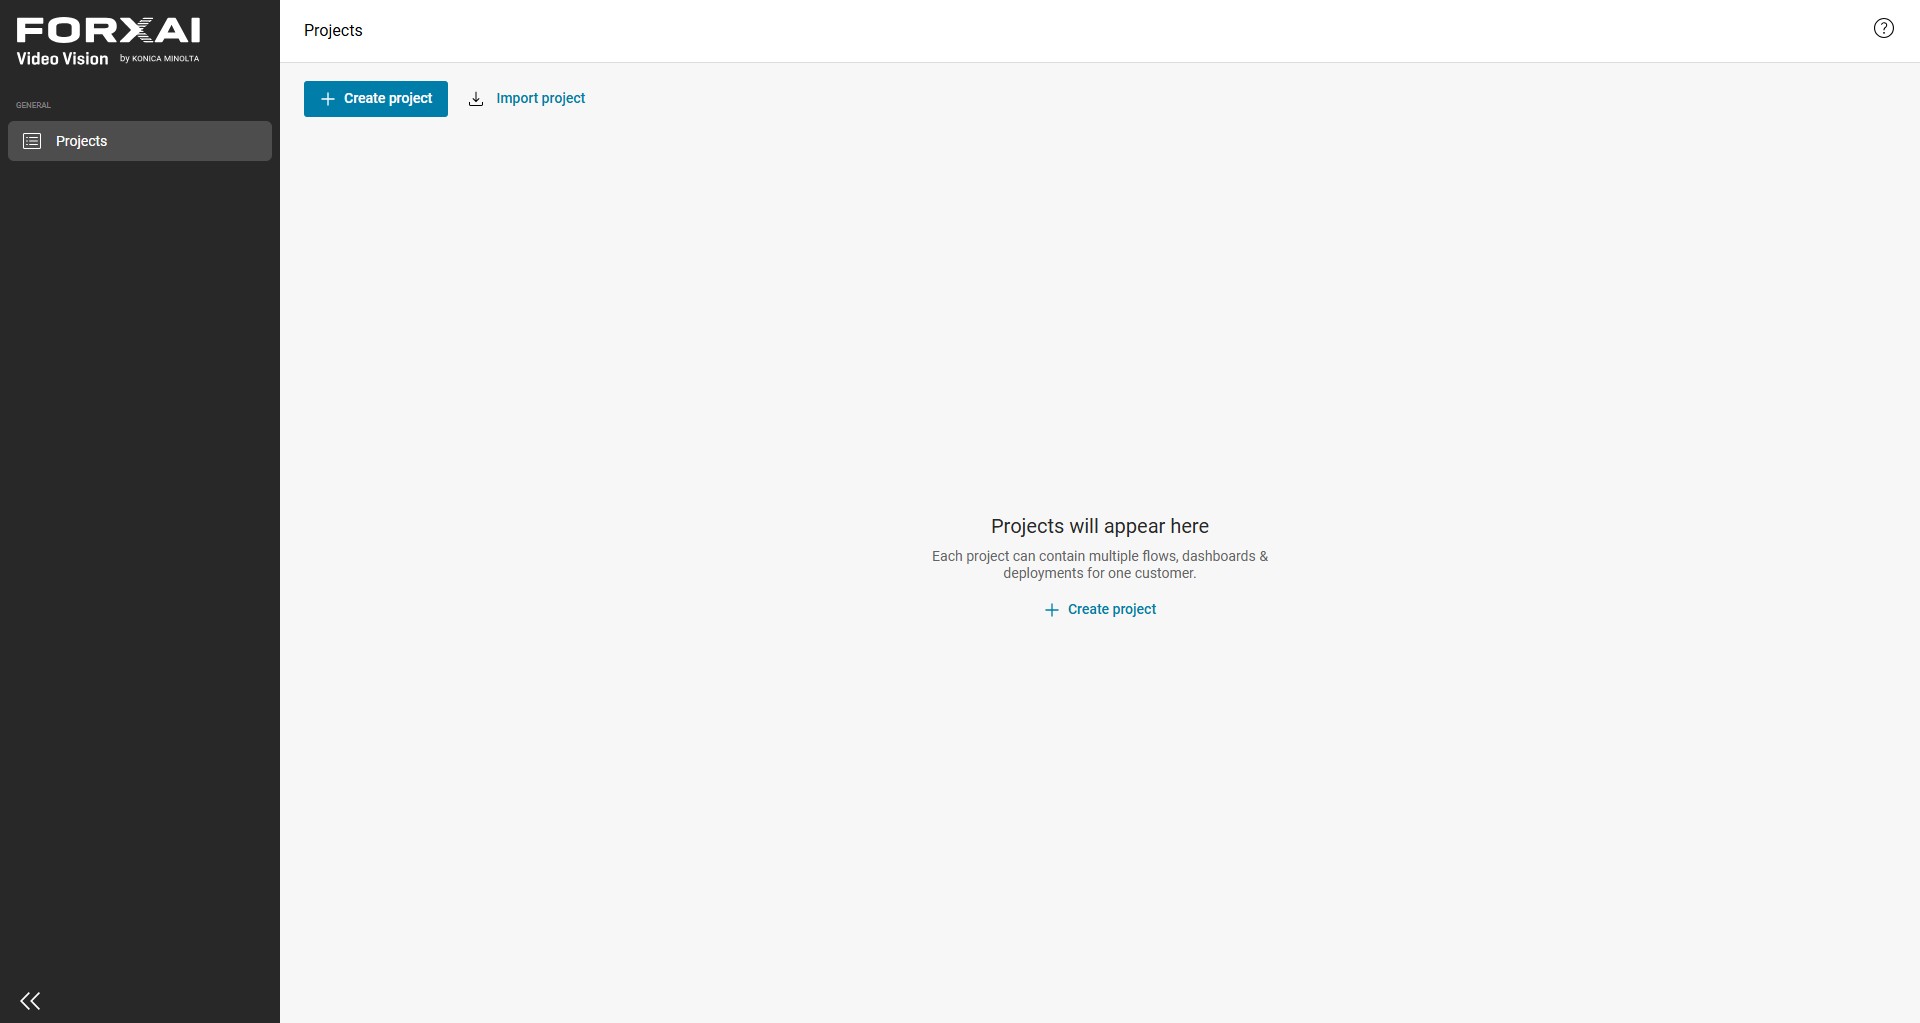
- Click on
Builderin the sidebar. This will open theBuilderinterface.
- Click on
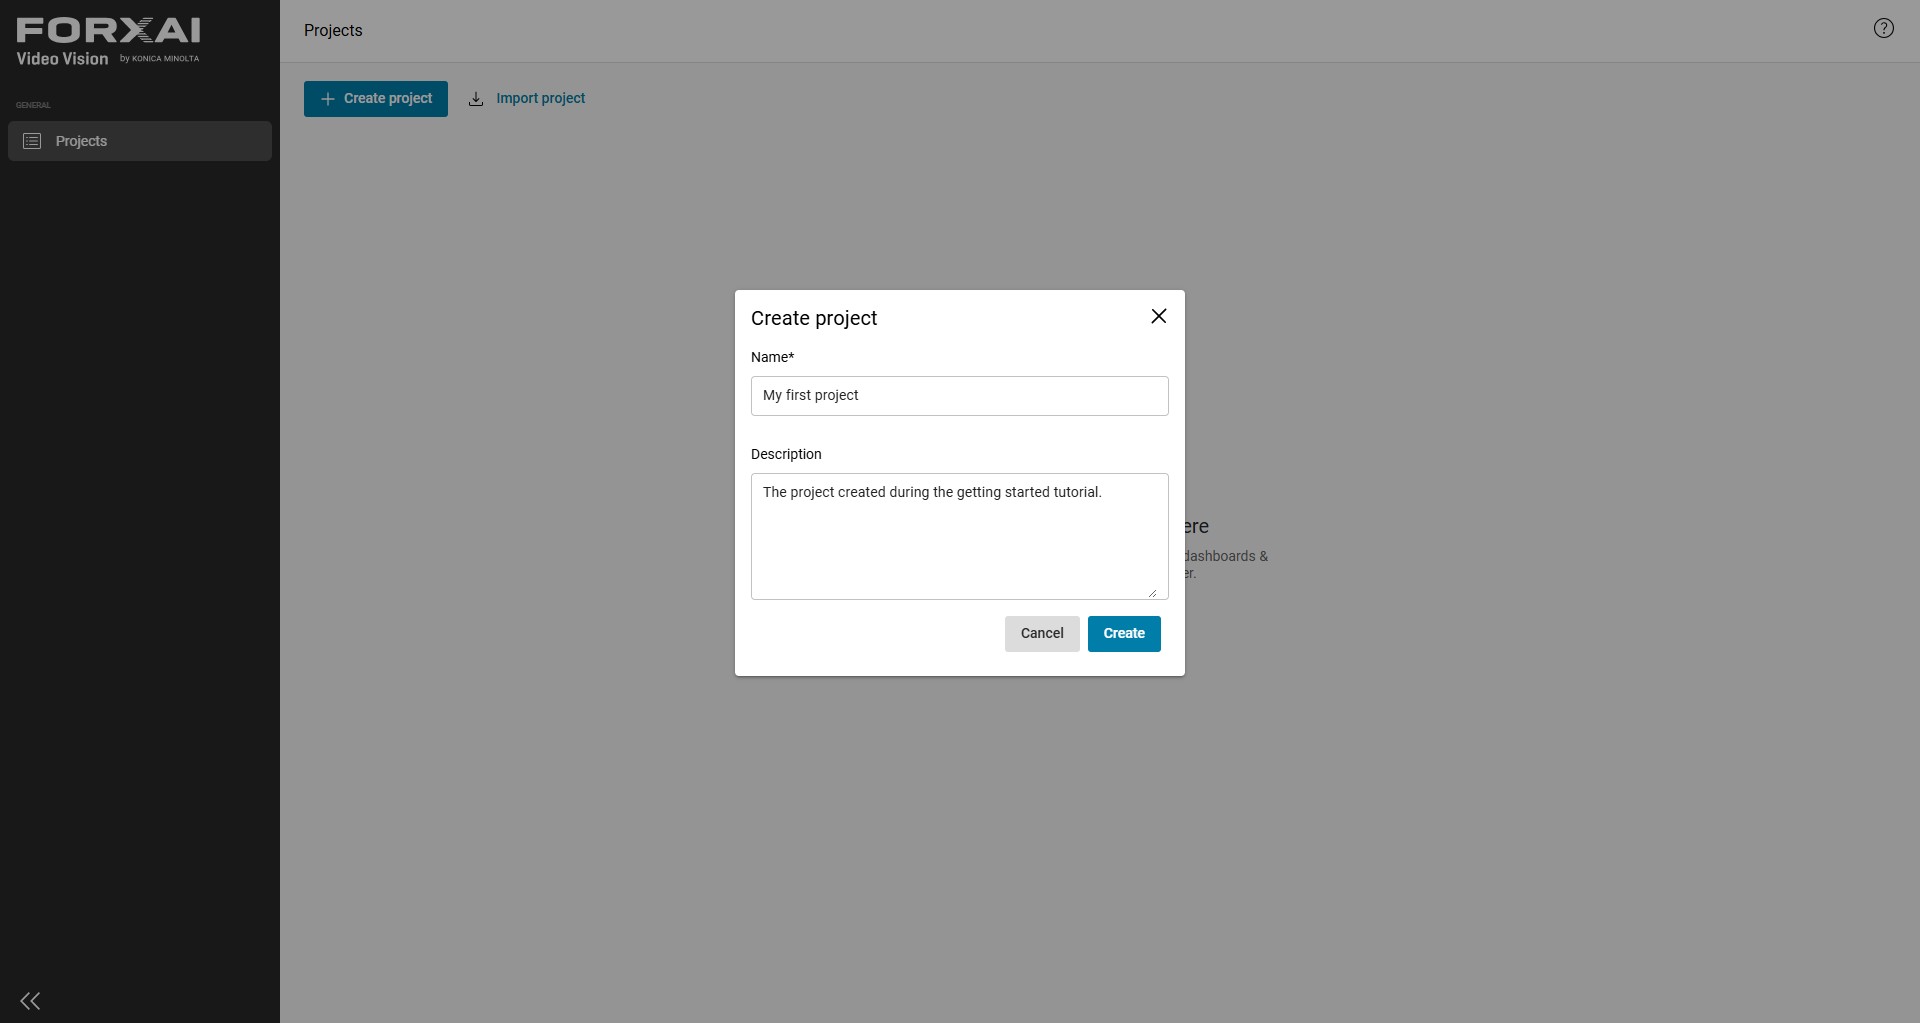
Create projectto create your first project. TheCreate projectdialog appears. TypeMy first projectin theNamefield and optionally add a description in theDescriptionfield.
- Click
Create. The project is created.
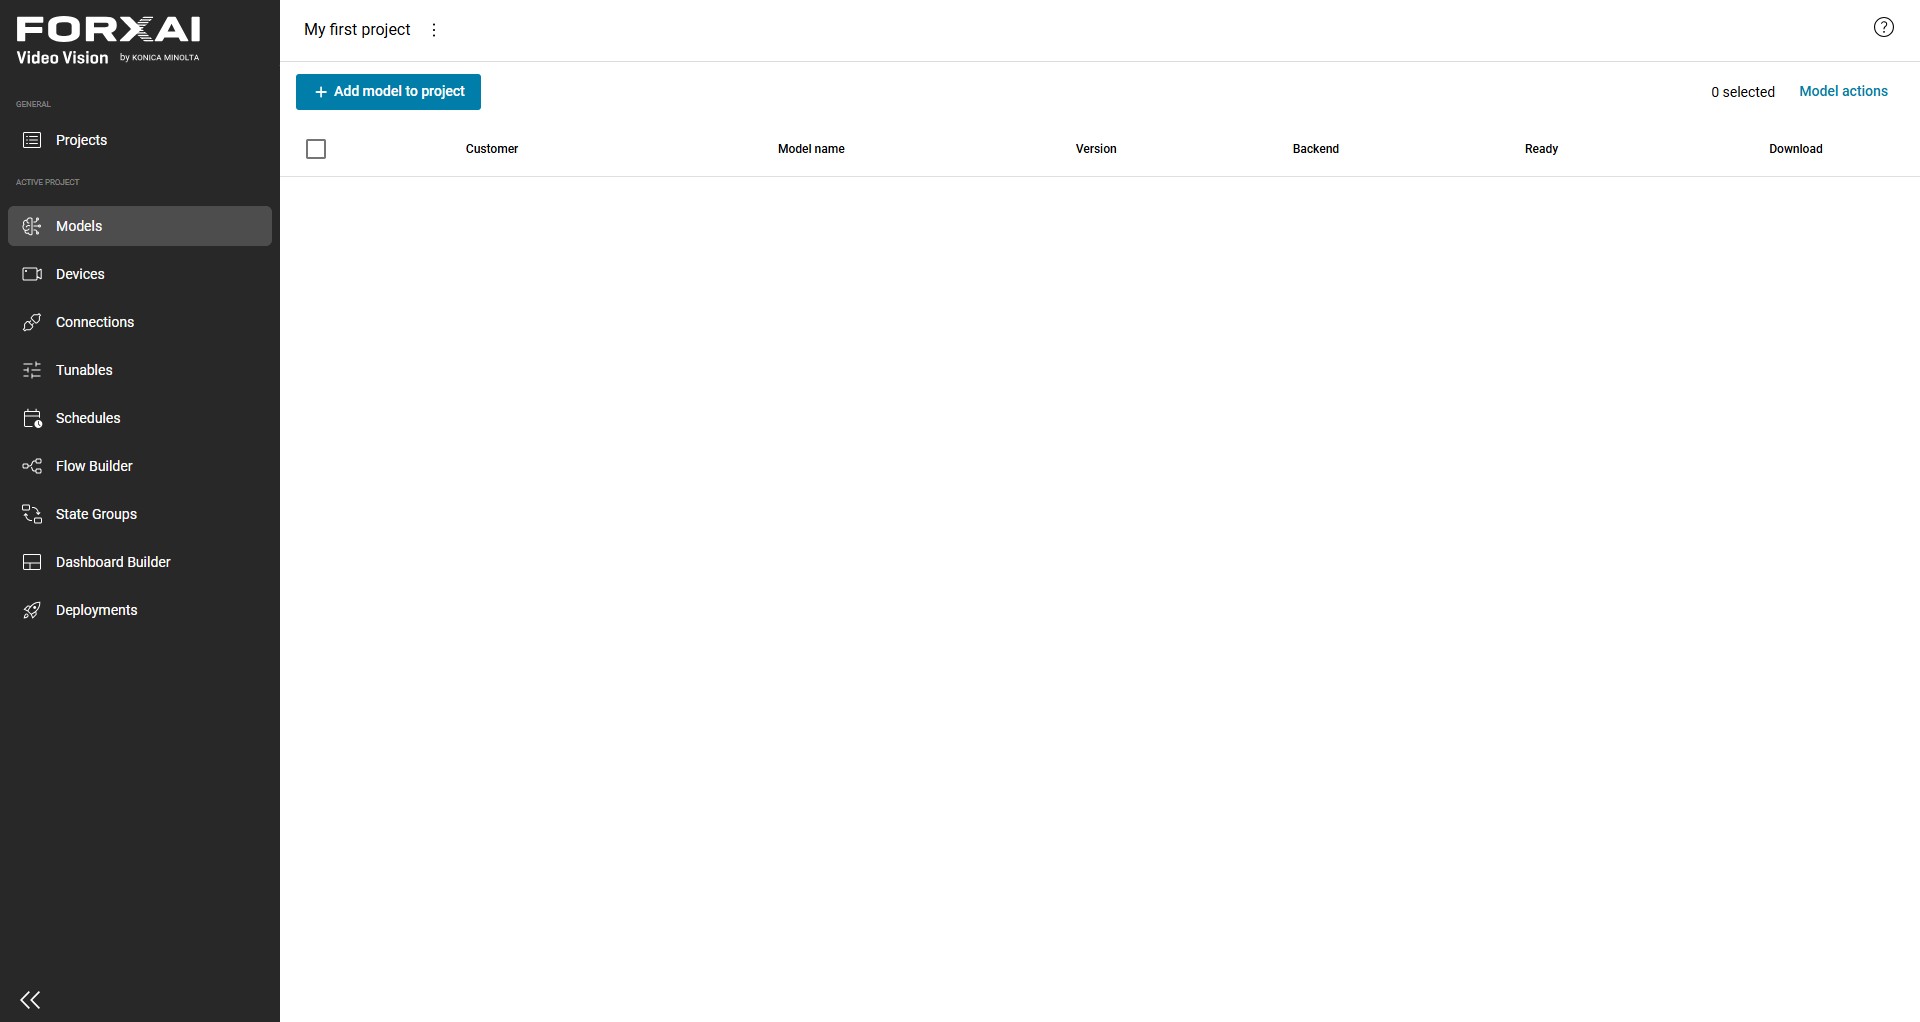
- In the sidebar, click on
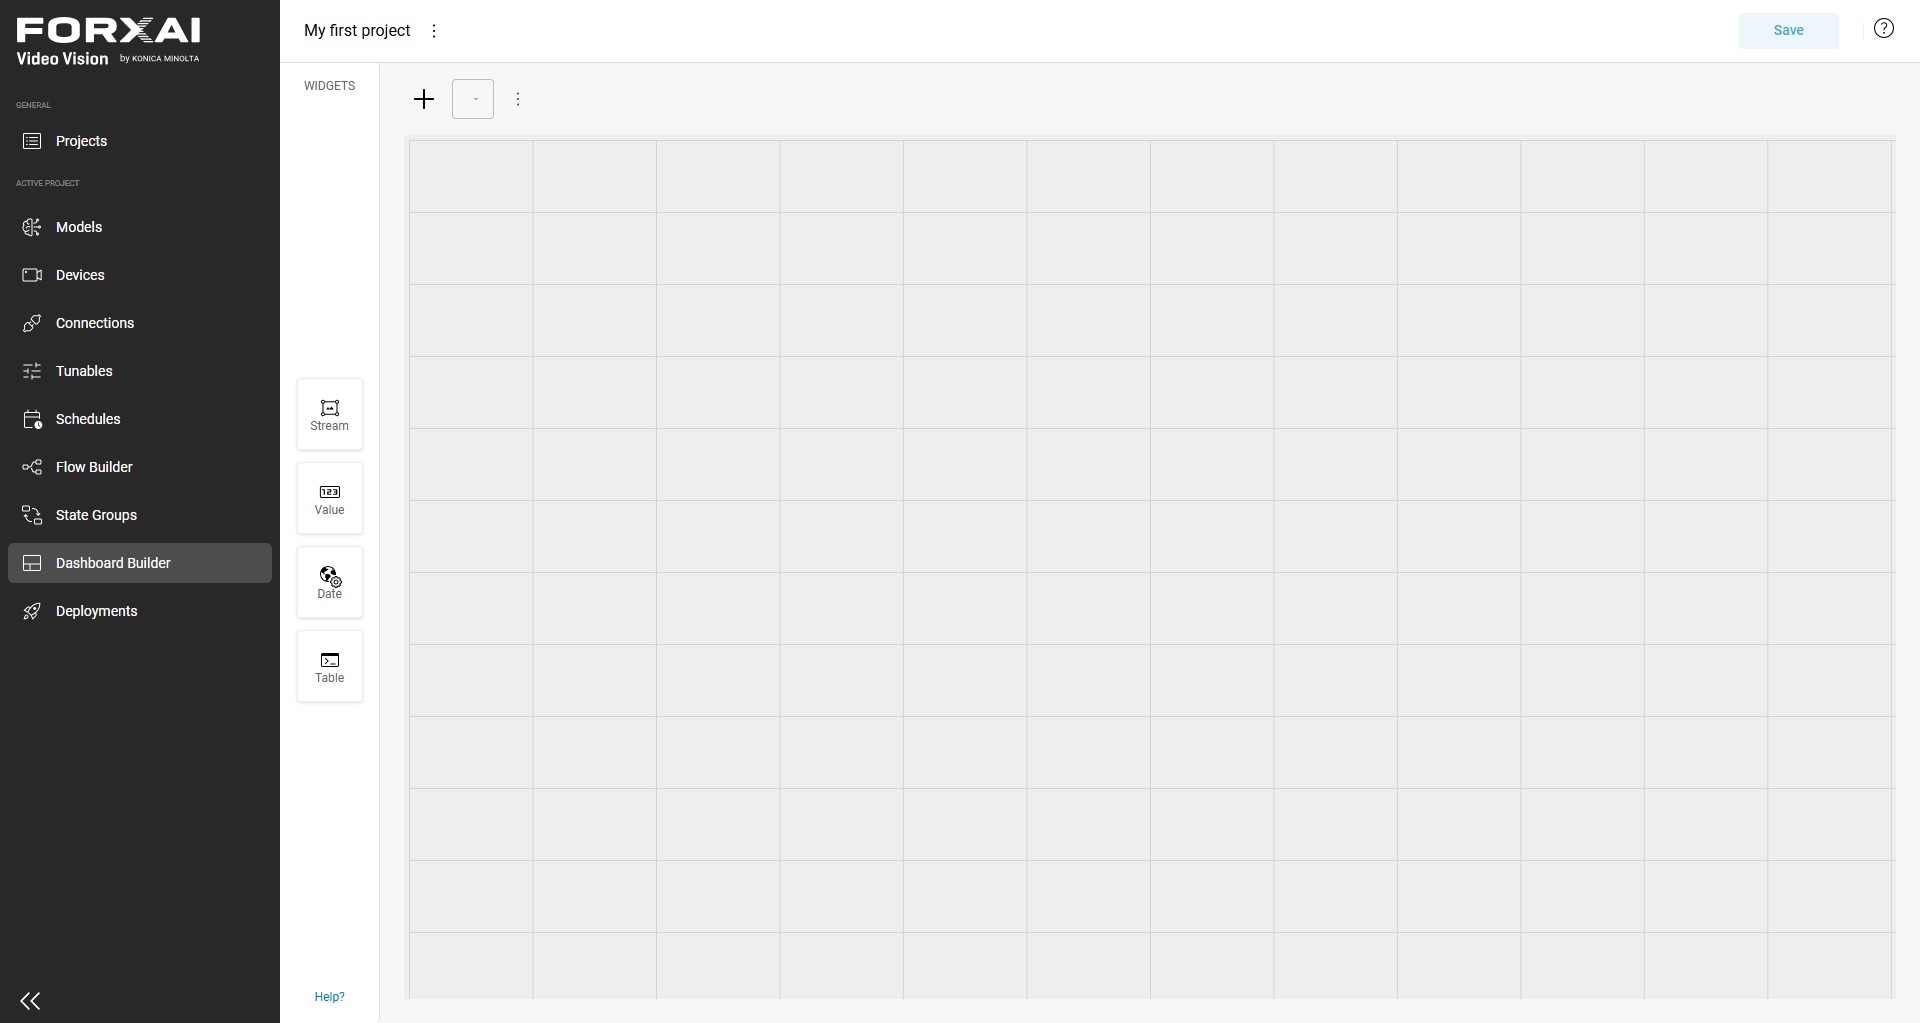
Dashboard Builder. The builder appears.
- Click on the
+button. In theCreate dashboarddialog typeMy first dashboardin theNamefield and optionally a description in theDescriptionfield.
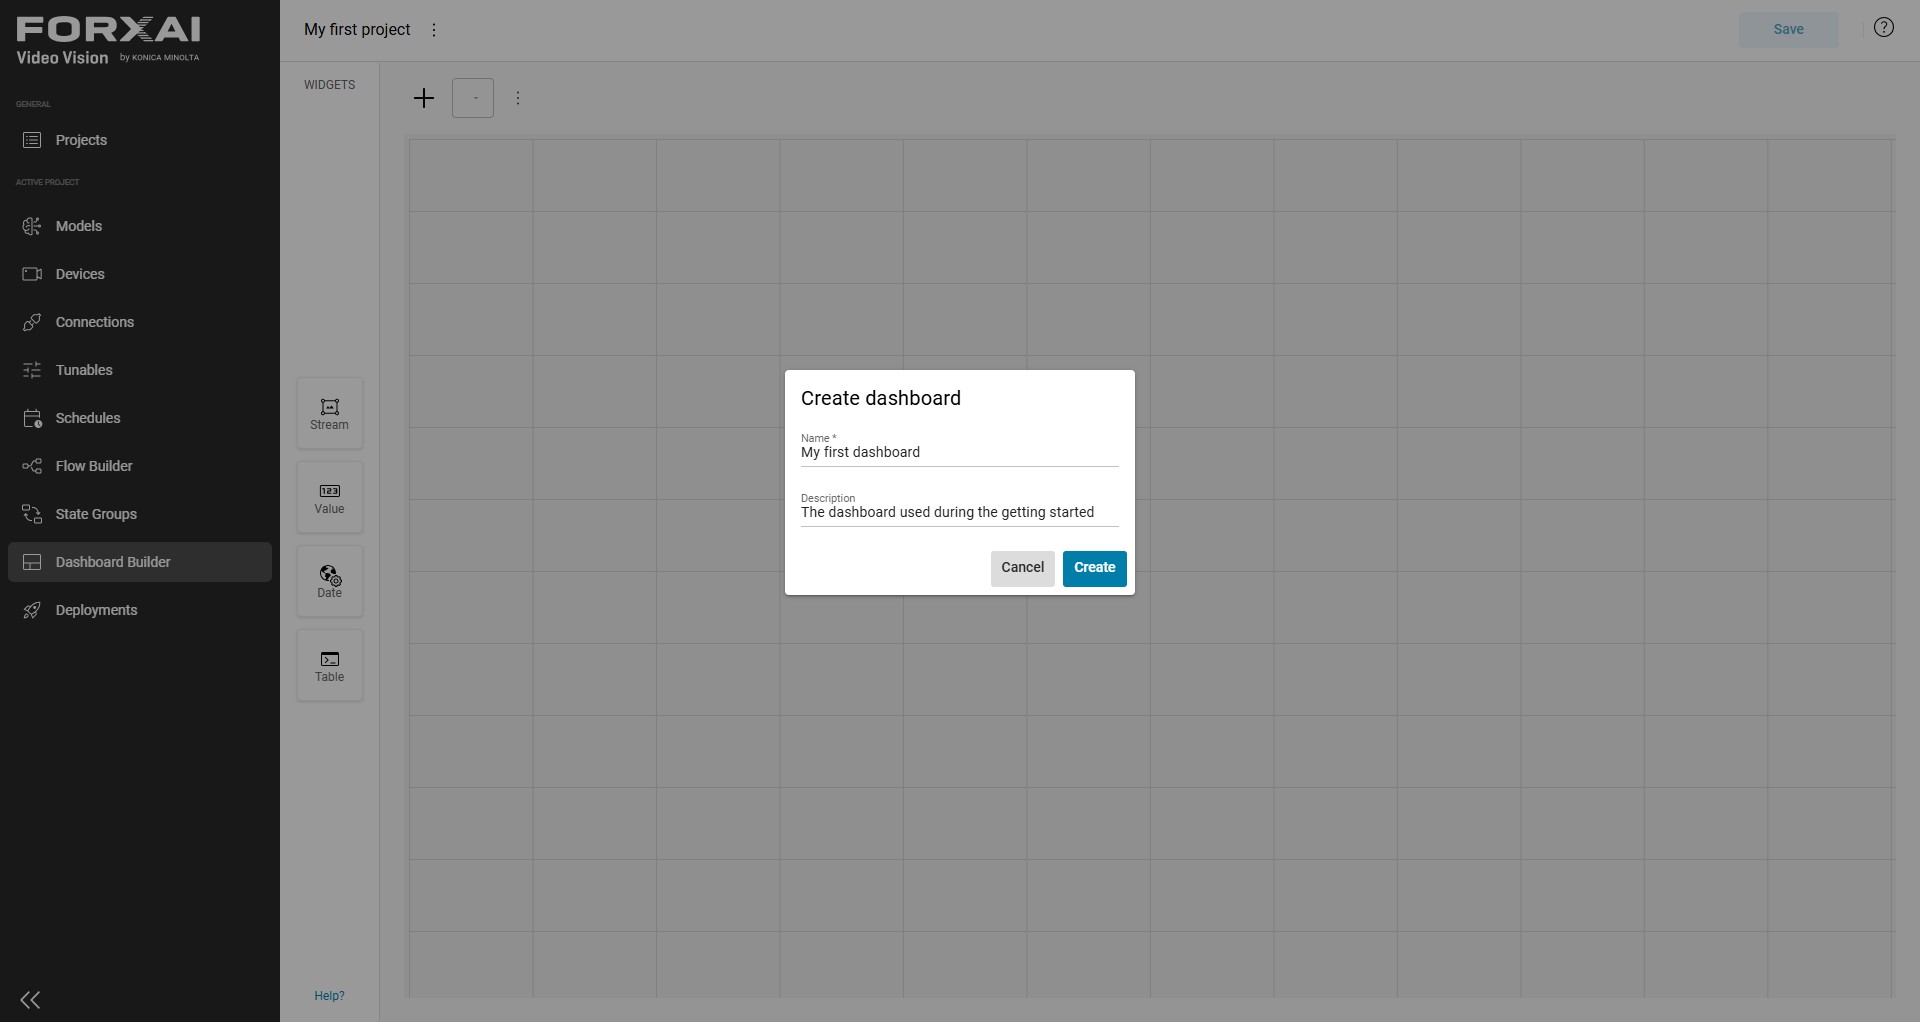
- Click on
Createto create the dashboard. - From the widget list, drag and drop the
Streamwidget into the canvas. The widget is positioned on the canvas.
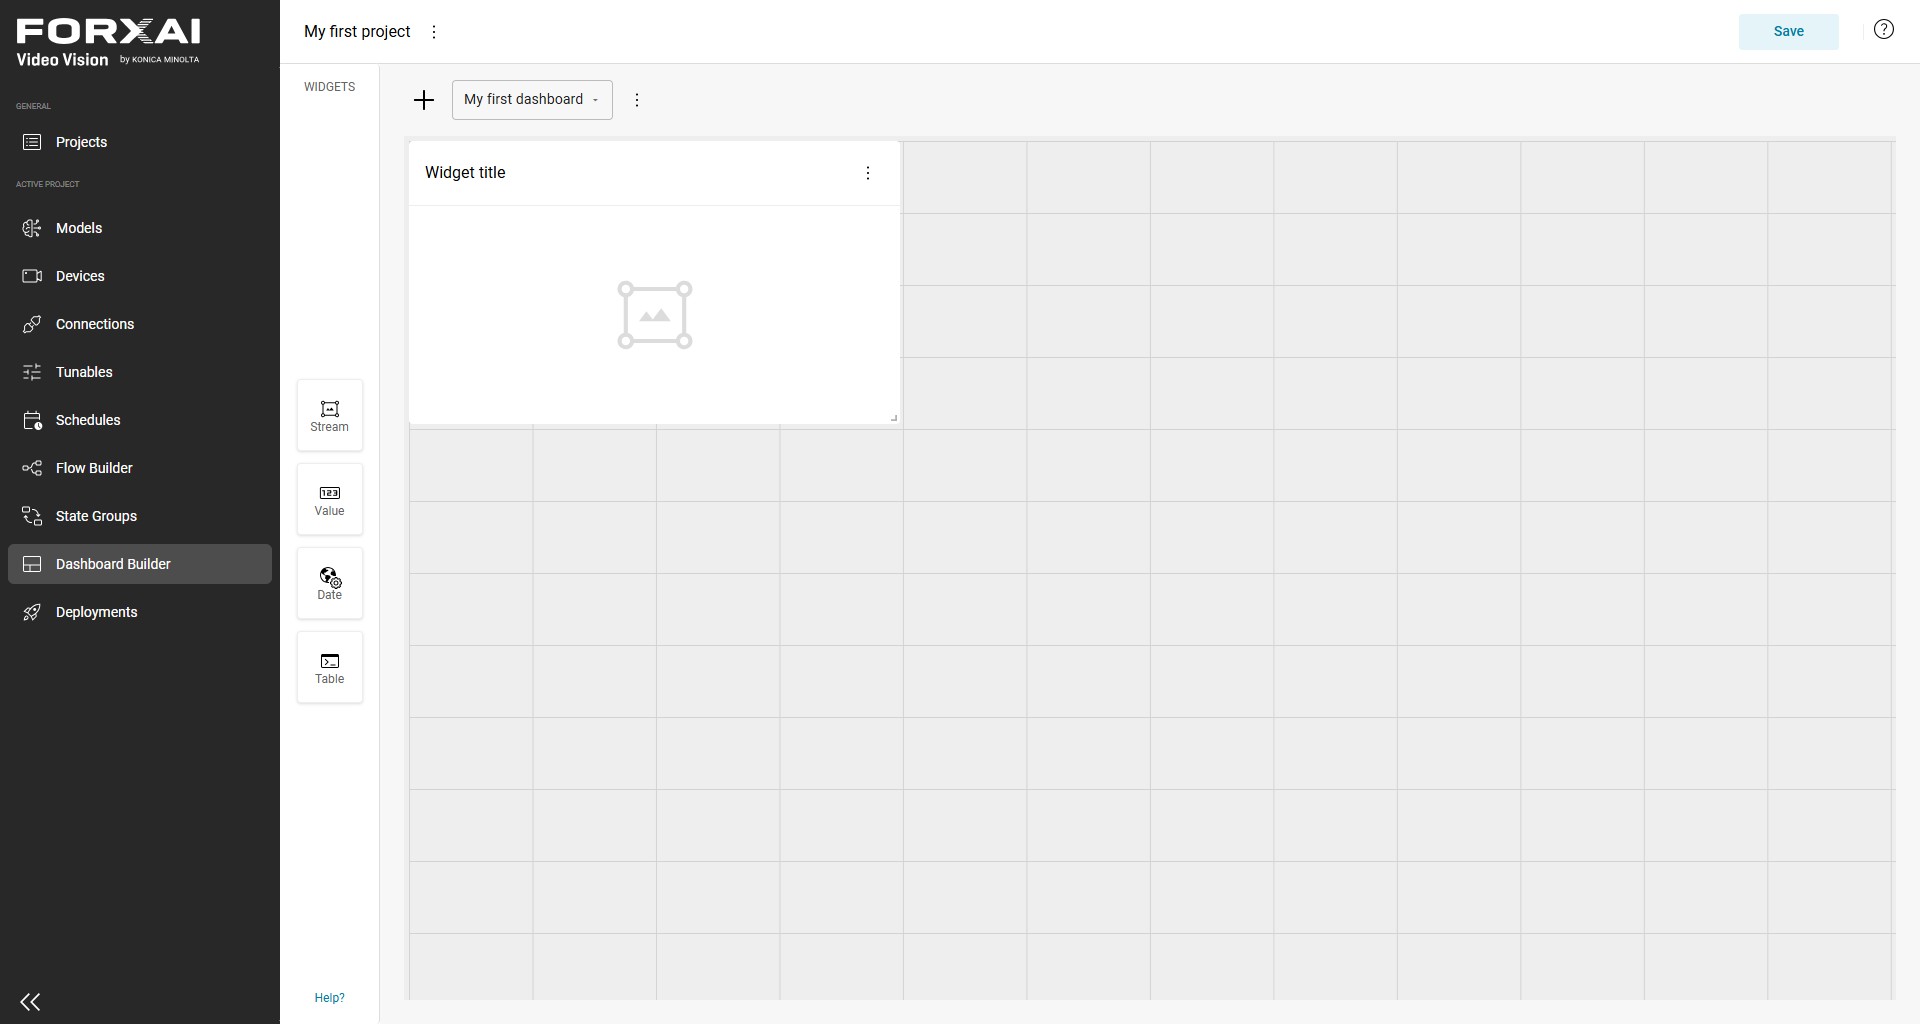
💡 You can adjust the widget's size by dragging the bottom right corner.
Click on the kebab menu (the three little dots in the top right corner of the widget), then click on
Editto configure the widget.In the
Stream Widget Configuration:- Set the
TitletoCamera View - Activate the
Expandablecheckbox
- Set the
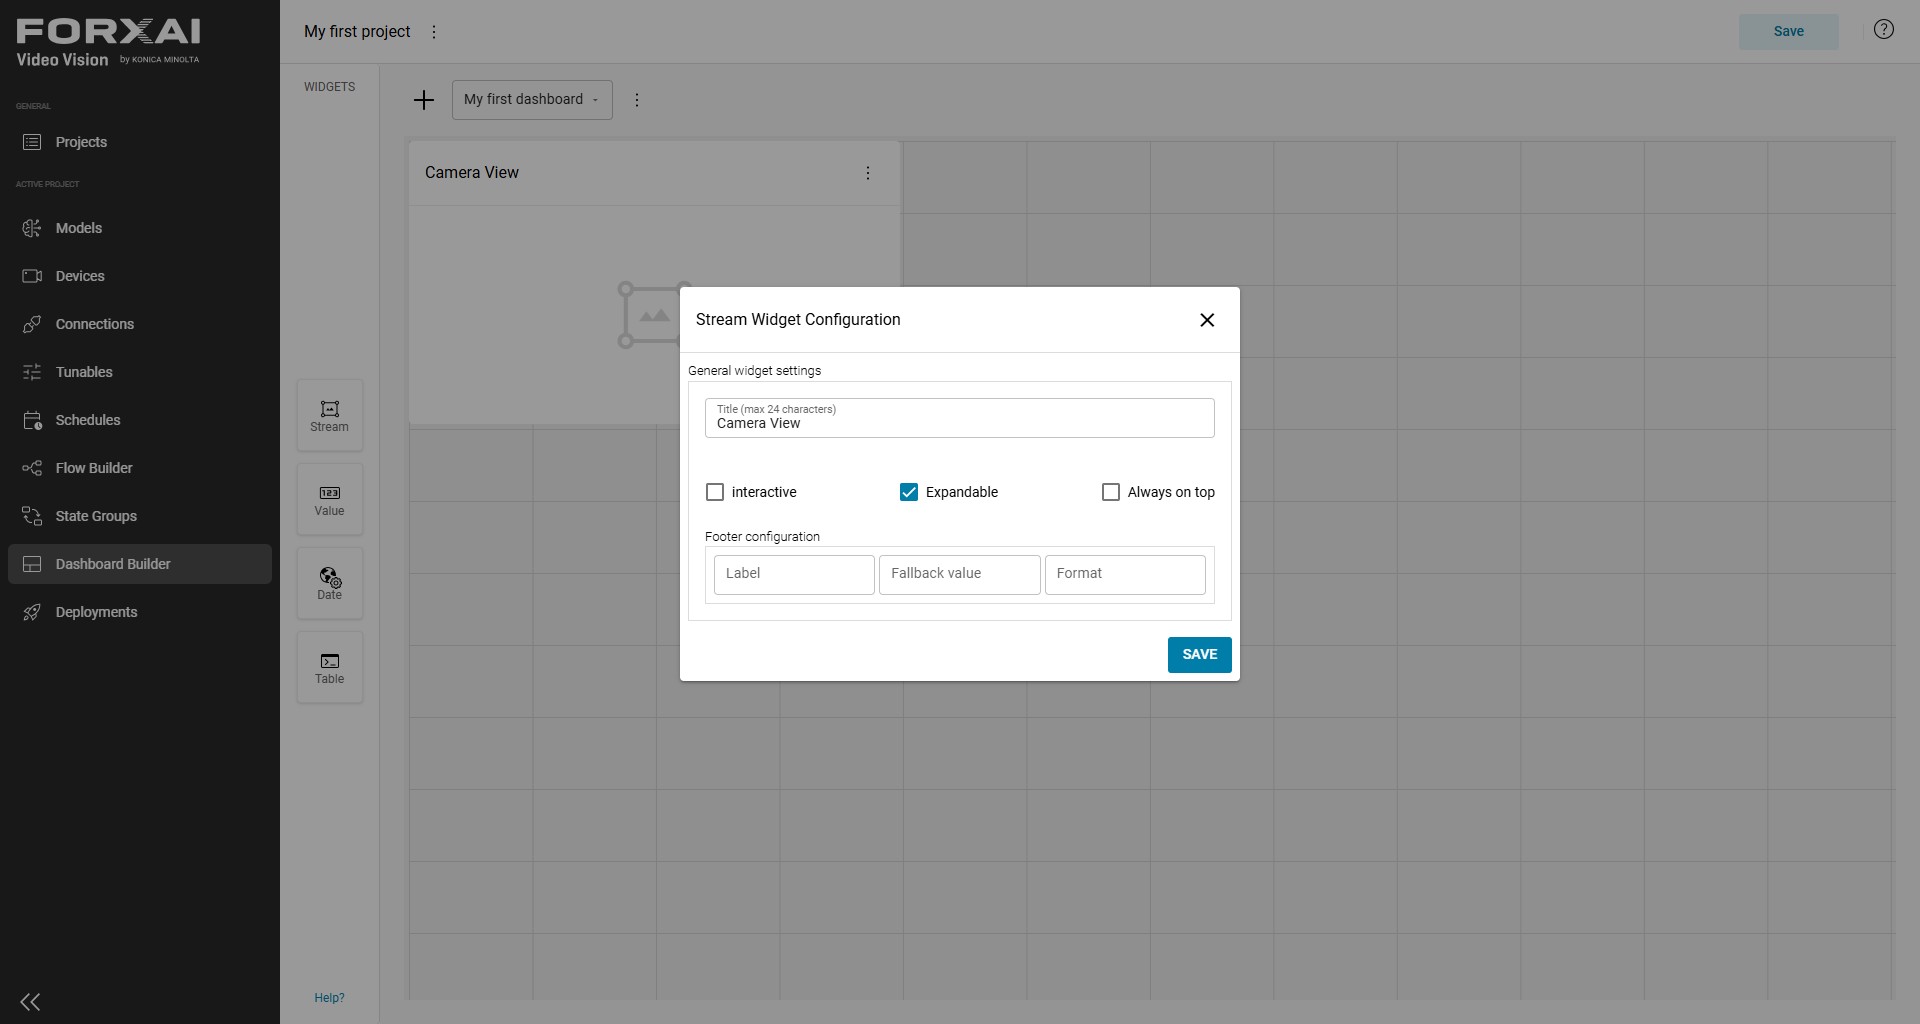
- Click
Saveto store the changes. - Drag and drop a
Valuewidget on the canvas. - Click the kebab menu. Click
Editto open the configuration panel. Set theTitletoFrame Countand clickSave.
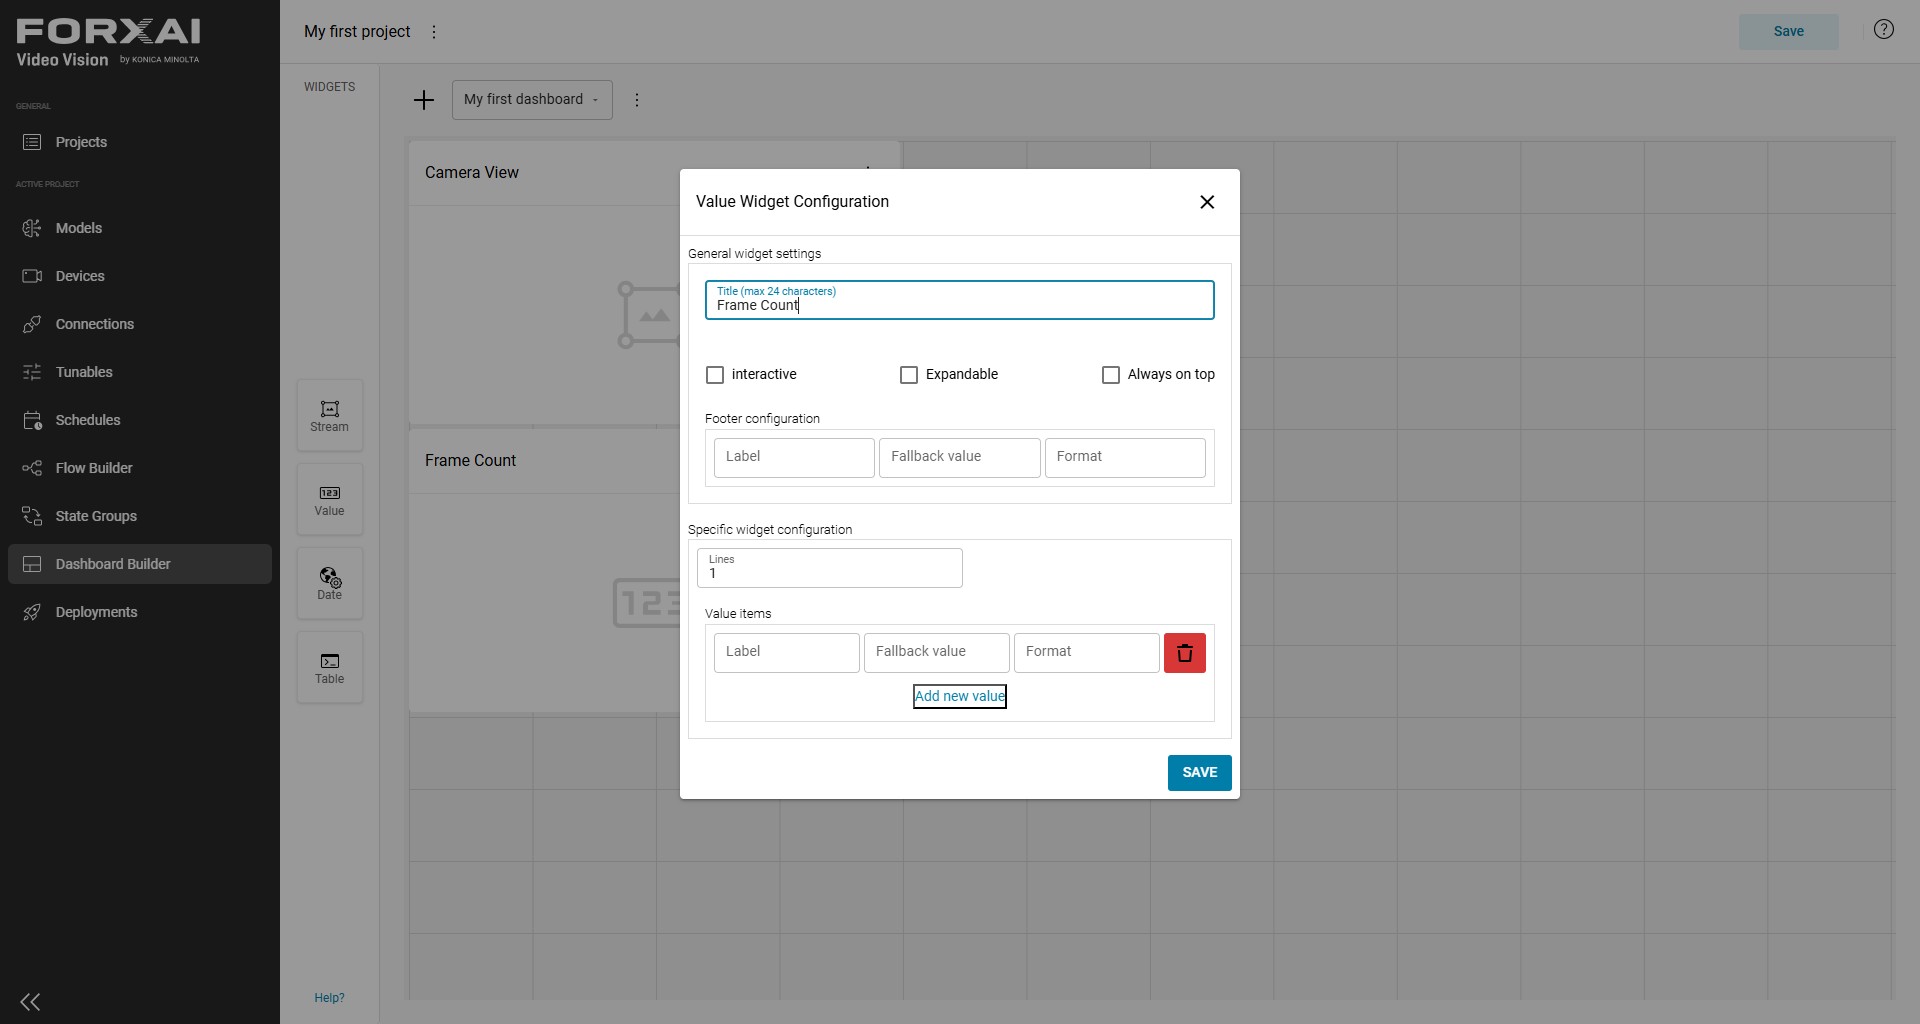
- Add 4 new value widgets to the canvas. Name them:
BlueRedBlue TotalRed Total
Repeat steps 11 and 12 per each new widget.
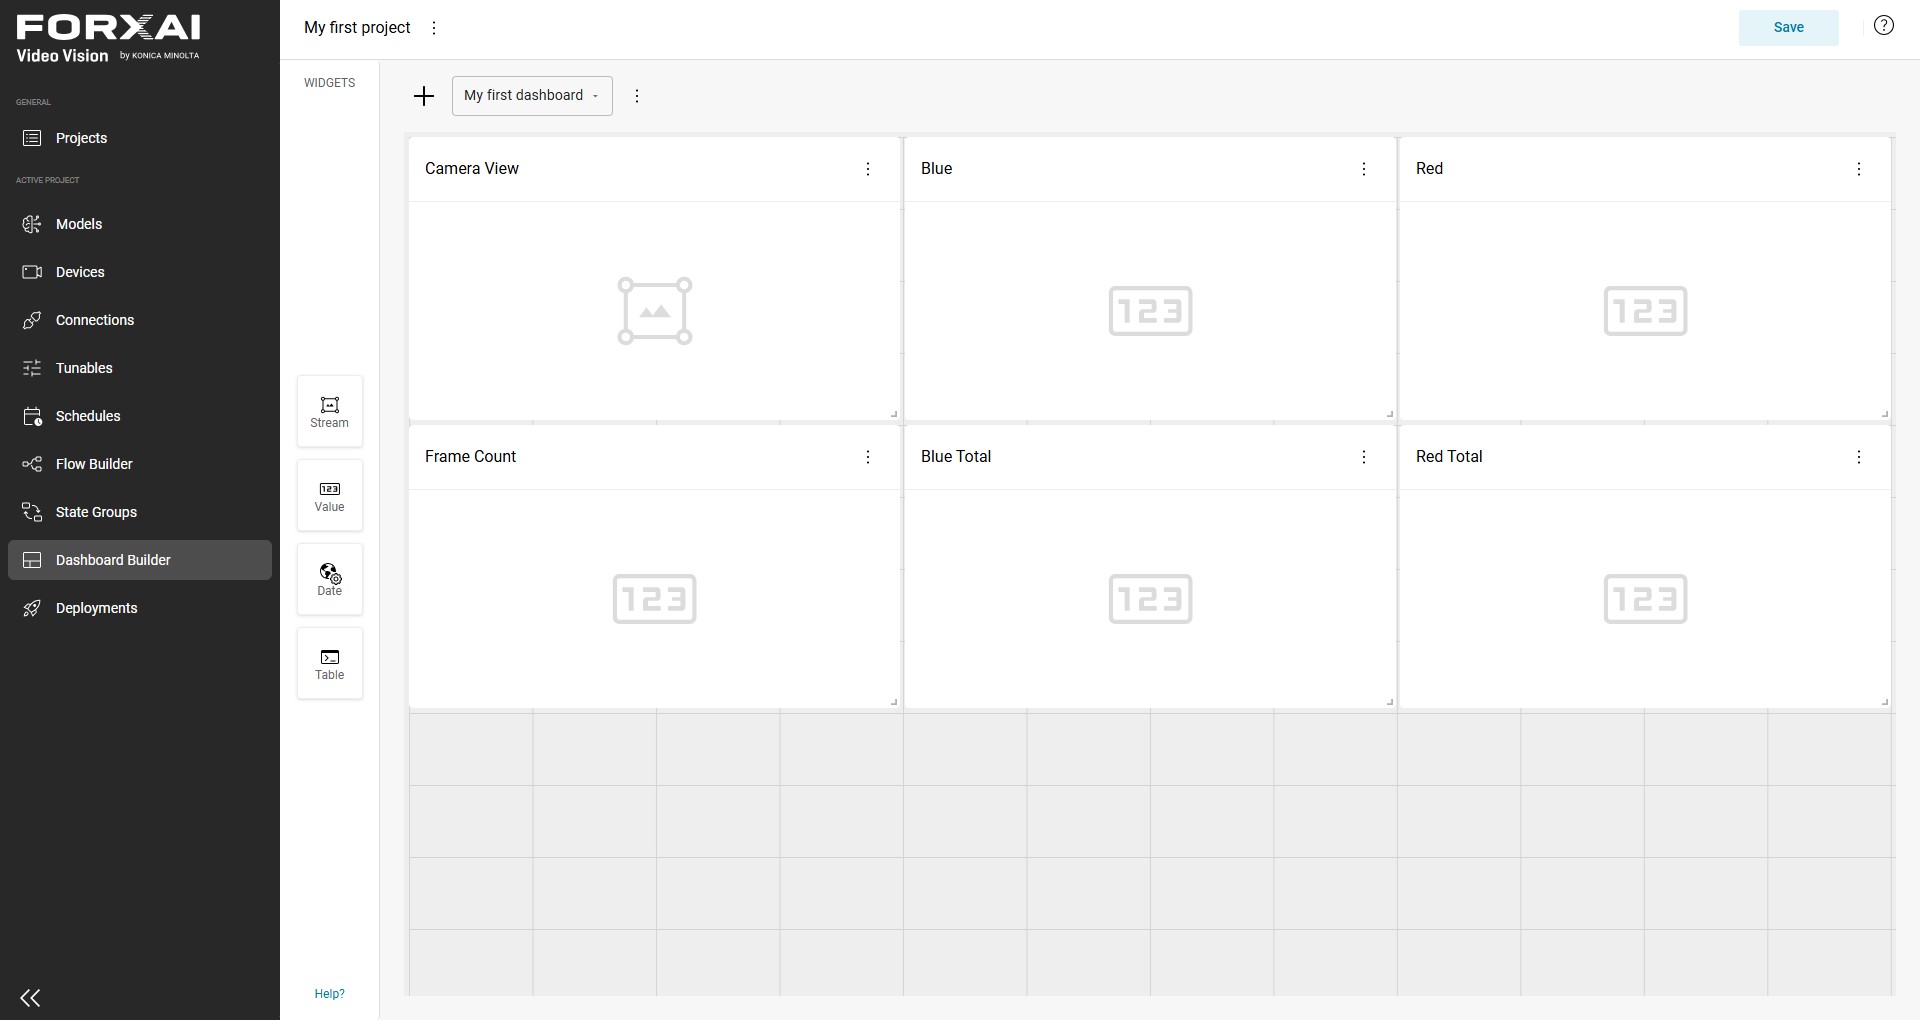
- Click
Saveto save your new dashboard.
💡 Create your dashboards first, and the business logic next. This will facilitate your development.
Step 3 : Create your first flow
In this step, you will create your first flow, starting with the input and the output nodes.
- Click on
Flow Builderin the sidebar. - Click on the
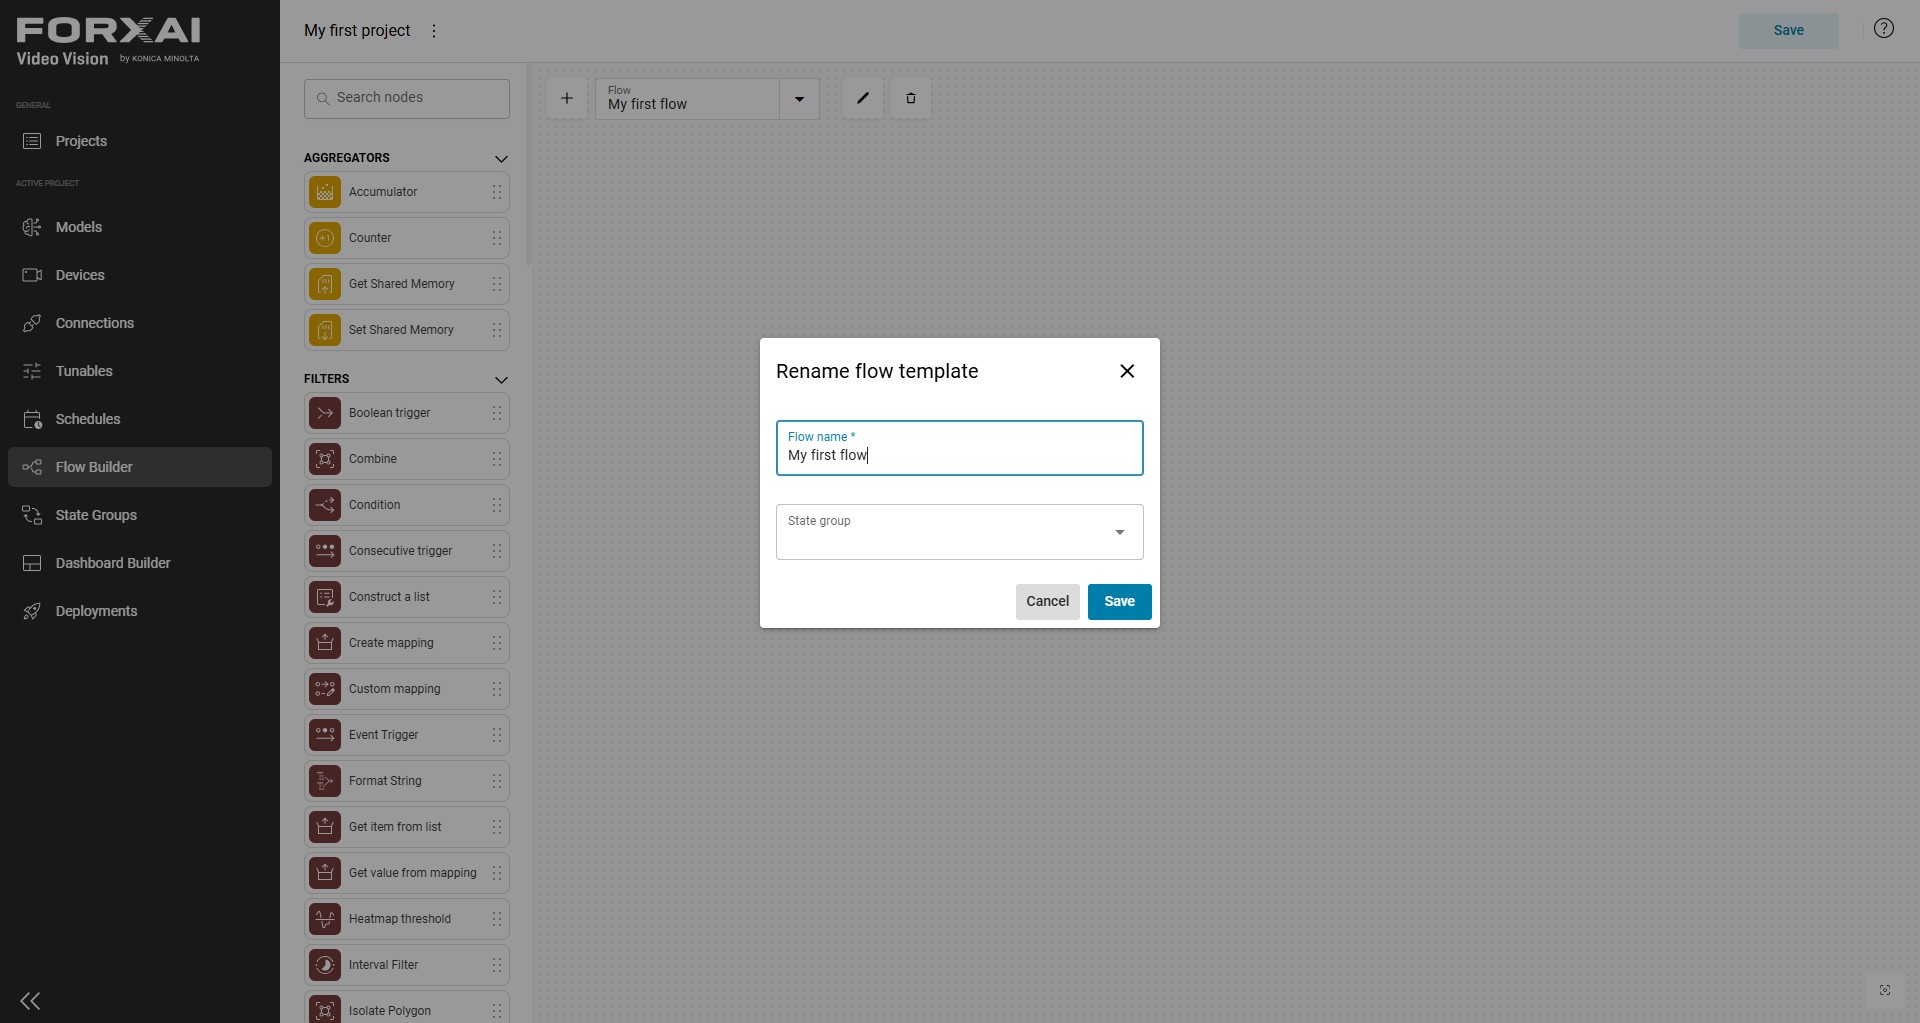
penicon at the top of the page on the left. - In the
Rename flow templatedialog typeMy first flowin theFlow namefield and clickSaveto save the changes.
- Click the
Savebutton at the top-right of the page.
💡 Save the changes to the flow often. If you leave the page without saving, all unsaved changes will be lost.
- From the node list on the left, select the
Image Streamnode in theINPUTSgroup and drag it on the canvas. The node will appear on the canvas. - Type
VideoInon theCustom namefield of the node to update its name. - From the
OUTPUTSgroup, add theImagenode to the flow. Name itVideoOut. - From the
OUTPUTSgroup, add 5Numbernodes to the flow. Name them:FrameCountOutBlueOutRedOutBlueTotOutRedTotOut
- Left-click on the
imageouput of theVideoInnode and, without releasing the mouse button, connect it to theimageinput of theVideoOutnode. - Click
Saveto save the changes to the flow.
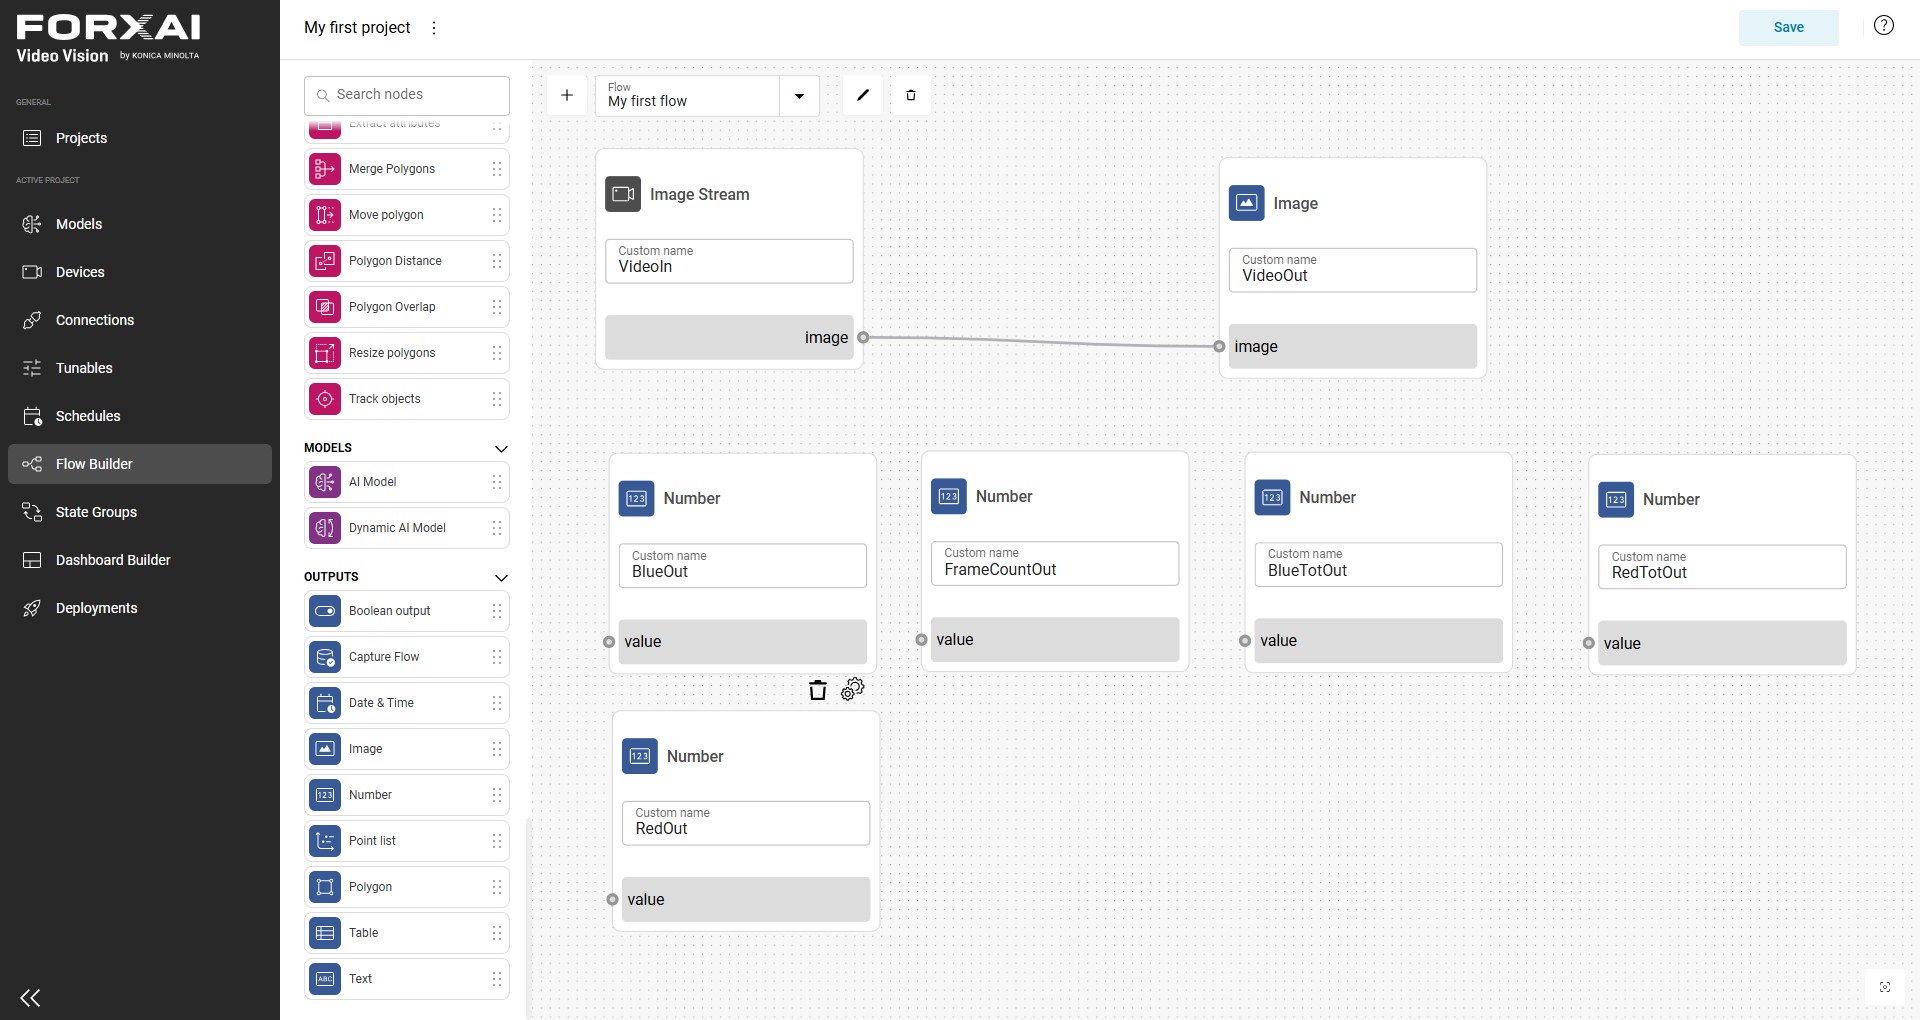
You have just created your first, very basic, flow template. It sends the image received from the camera by the VideoIn node to the VideoOut node, that will provide it to the dashboard.
The remaining unconnected output nodes will be used later in this tutorial.
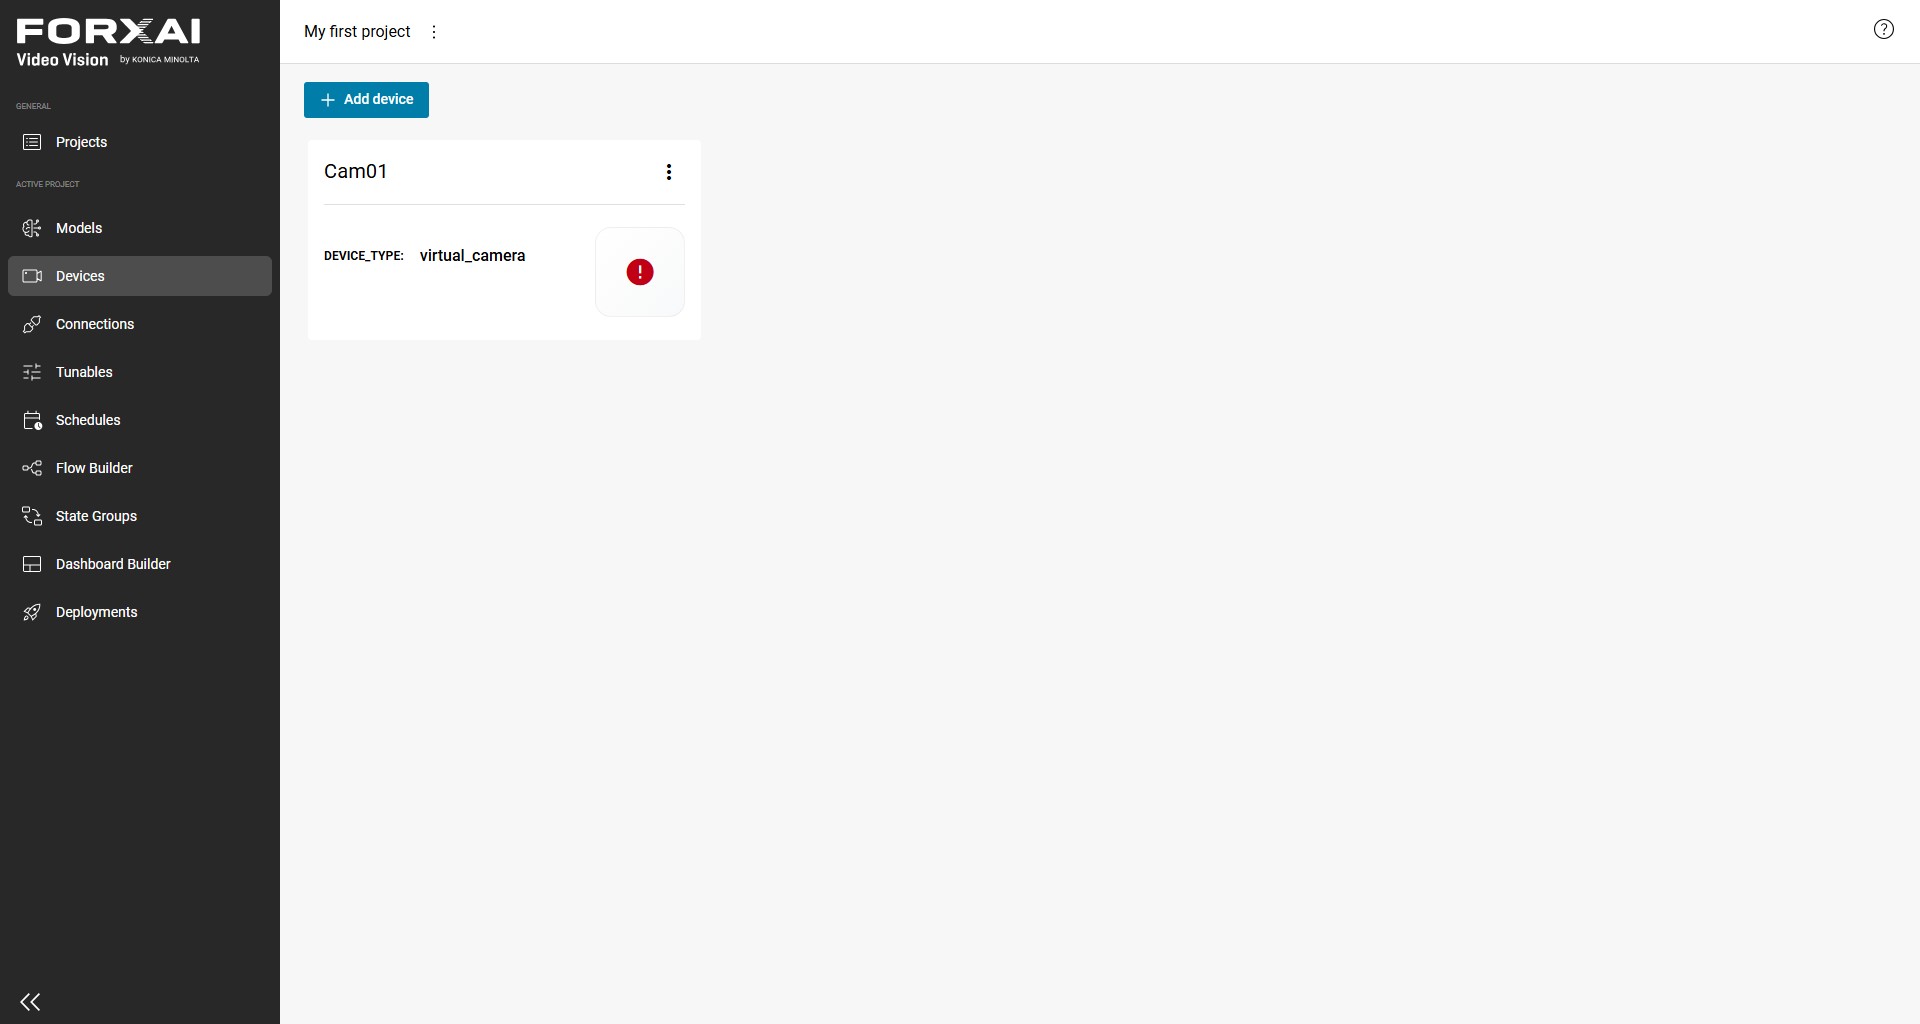
Step 4 : Create your first device
In this step, you will define the camera device that provides the video input to the VideoIn node.
- From the sidebar, click on
Devices. The device page appears. - Click on
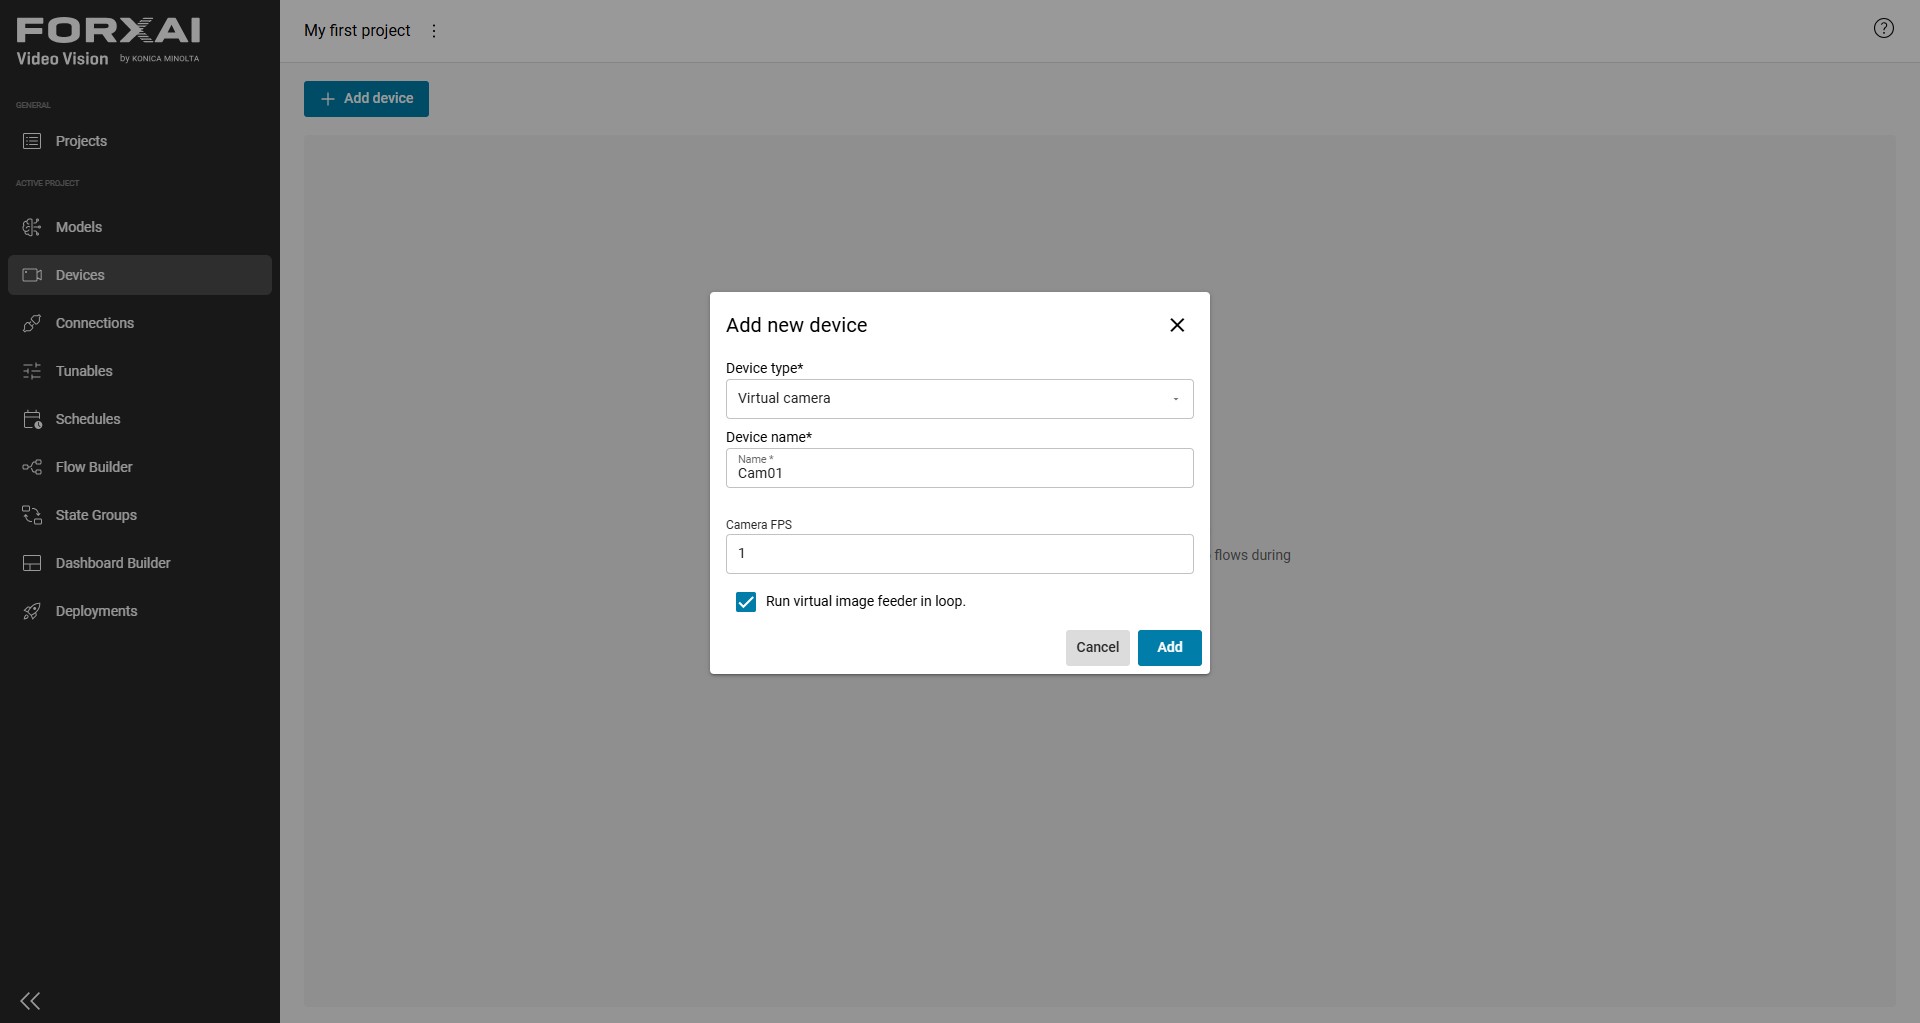
Add deviceto create your first device. - In the
Add new devicedialog:- Select
virtual camerafrom theDevice typedrop-down menu - Type
Cam01in theDevice namefield - Leave the default value
1in theCamera FPSfield - Activate the
Run virtual image feeder in loopcheckbox.
- Select
- Click
Addto add the new device to the list of project's devices.
Step 5 : Create your first deployment
You are now ready to create your first deployment, connecting all the pieces together to create a working application.
- Click
Deploymentson the sidebar - Click
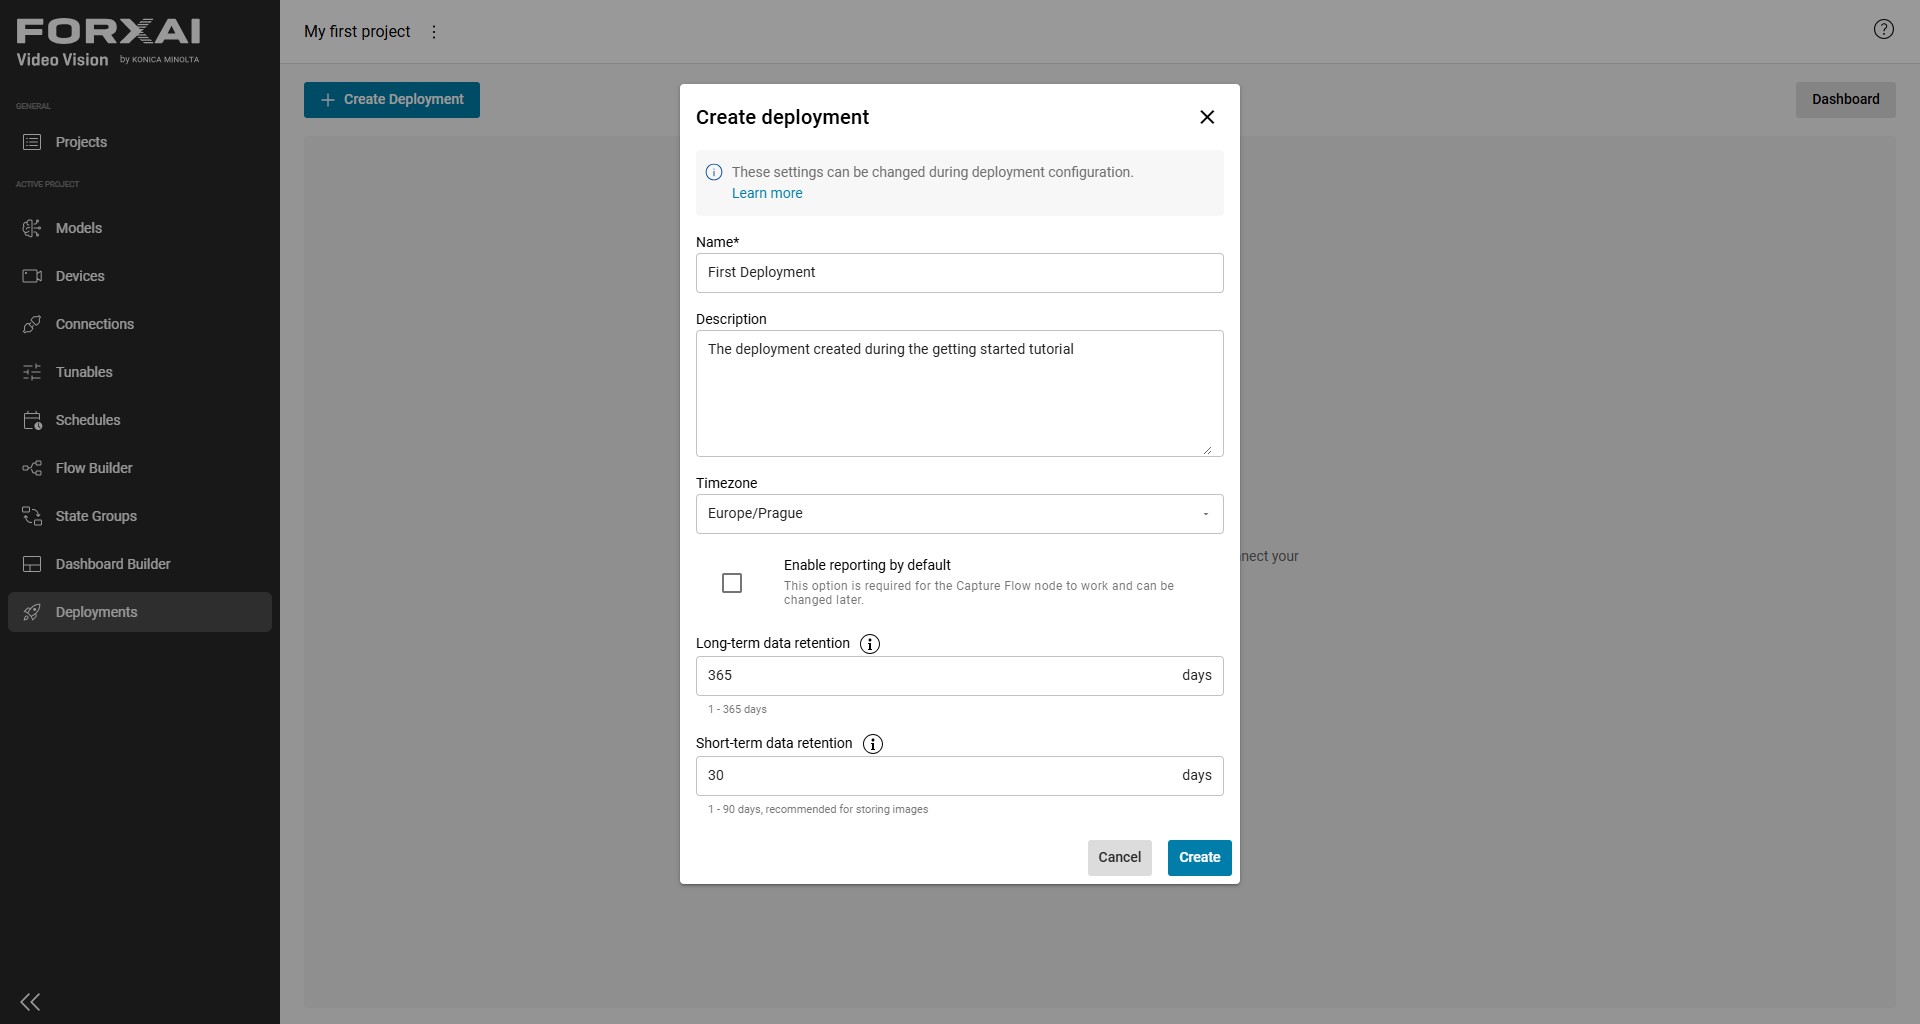
Create Deploymentto create your first deployment - In the
Create deploymentdialog:- Type
First Deploymentin theNamefield - Optionally add a Description
- Click
Createto create the deployment
- Type
- Click on the
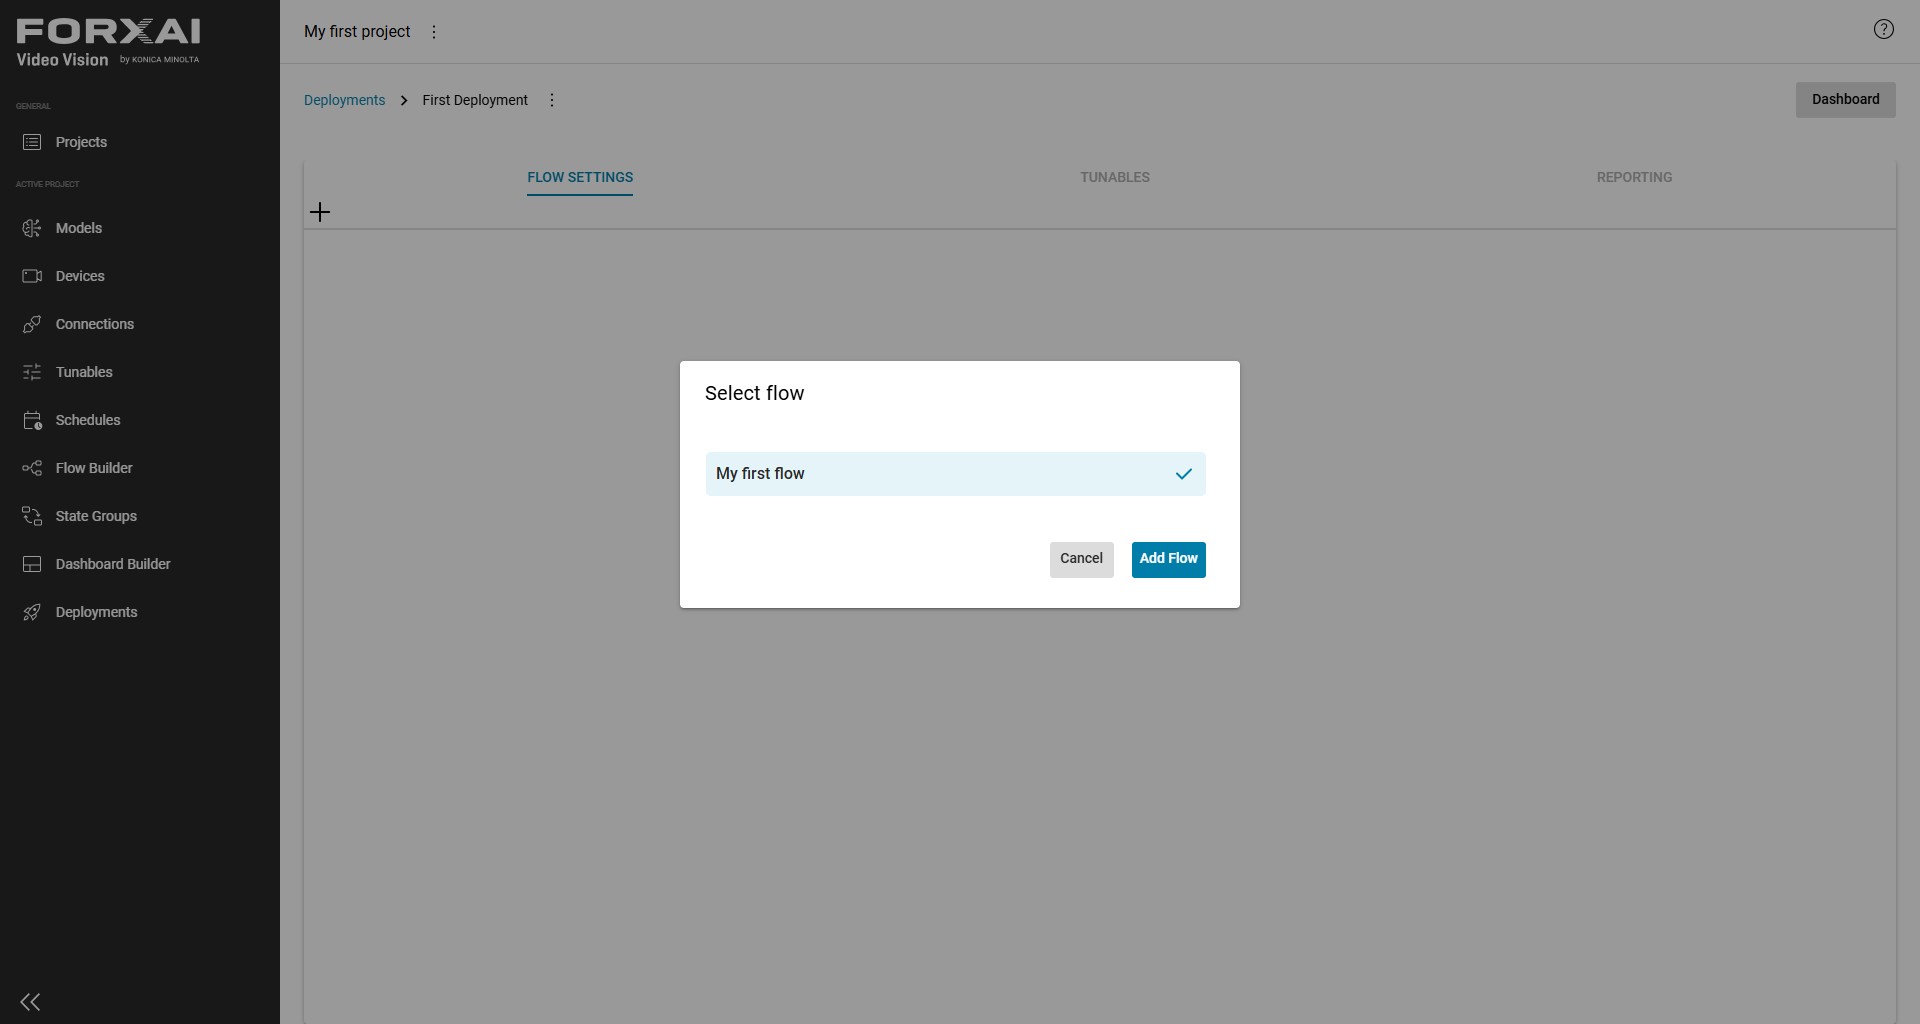
+icon to add a flow template to the deployment - In the
Select Flowdialog, click onMy first flowto select it. - Click on
Add Flowto add the flow to the deployment.
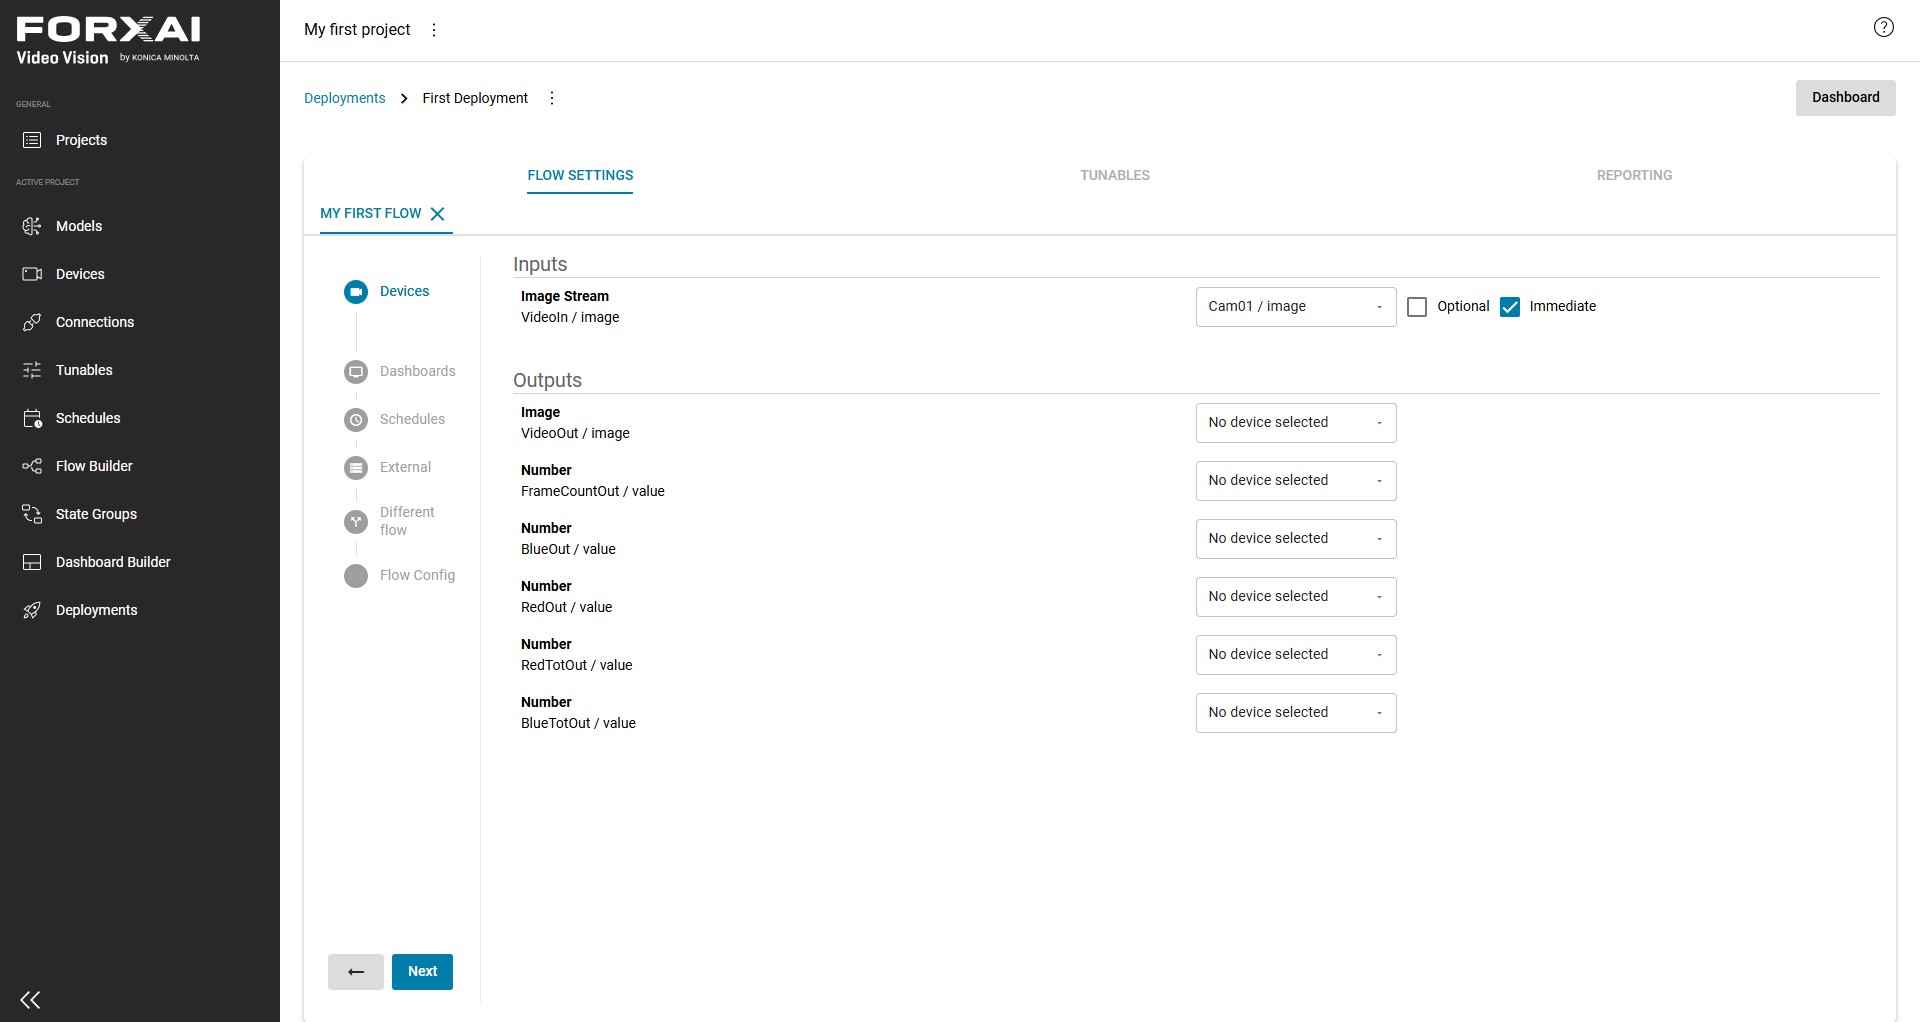
- In the menu on the left, select
Devices - Associate the
VideoIninput node with theCam01device. Check theImmediatecheck-box.
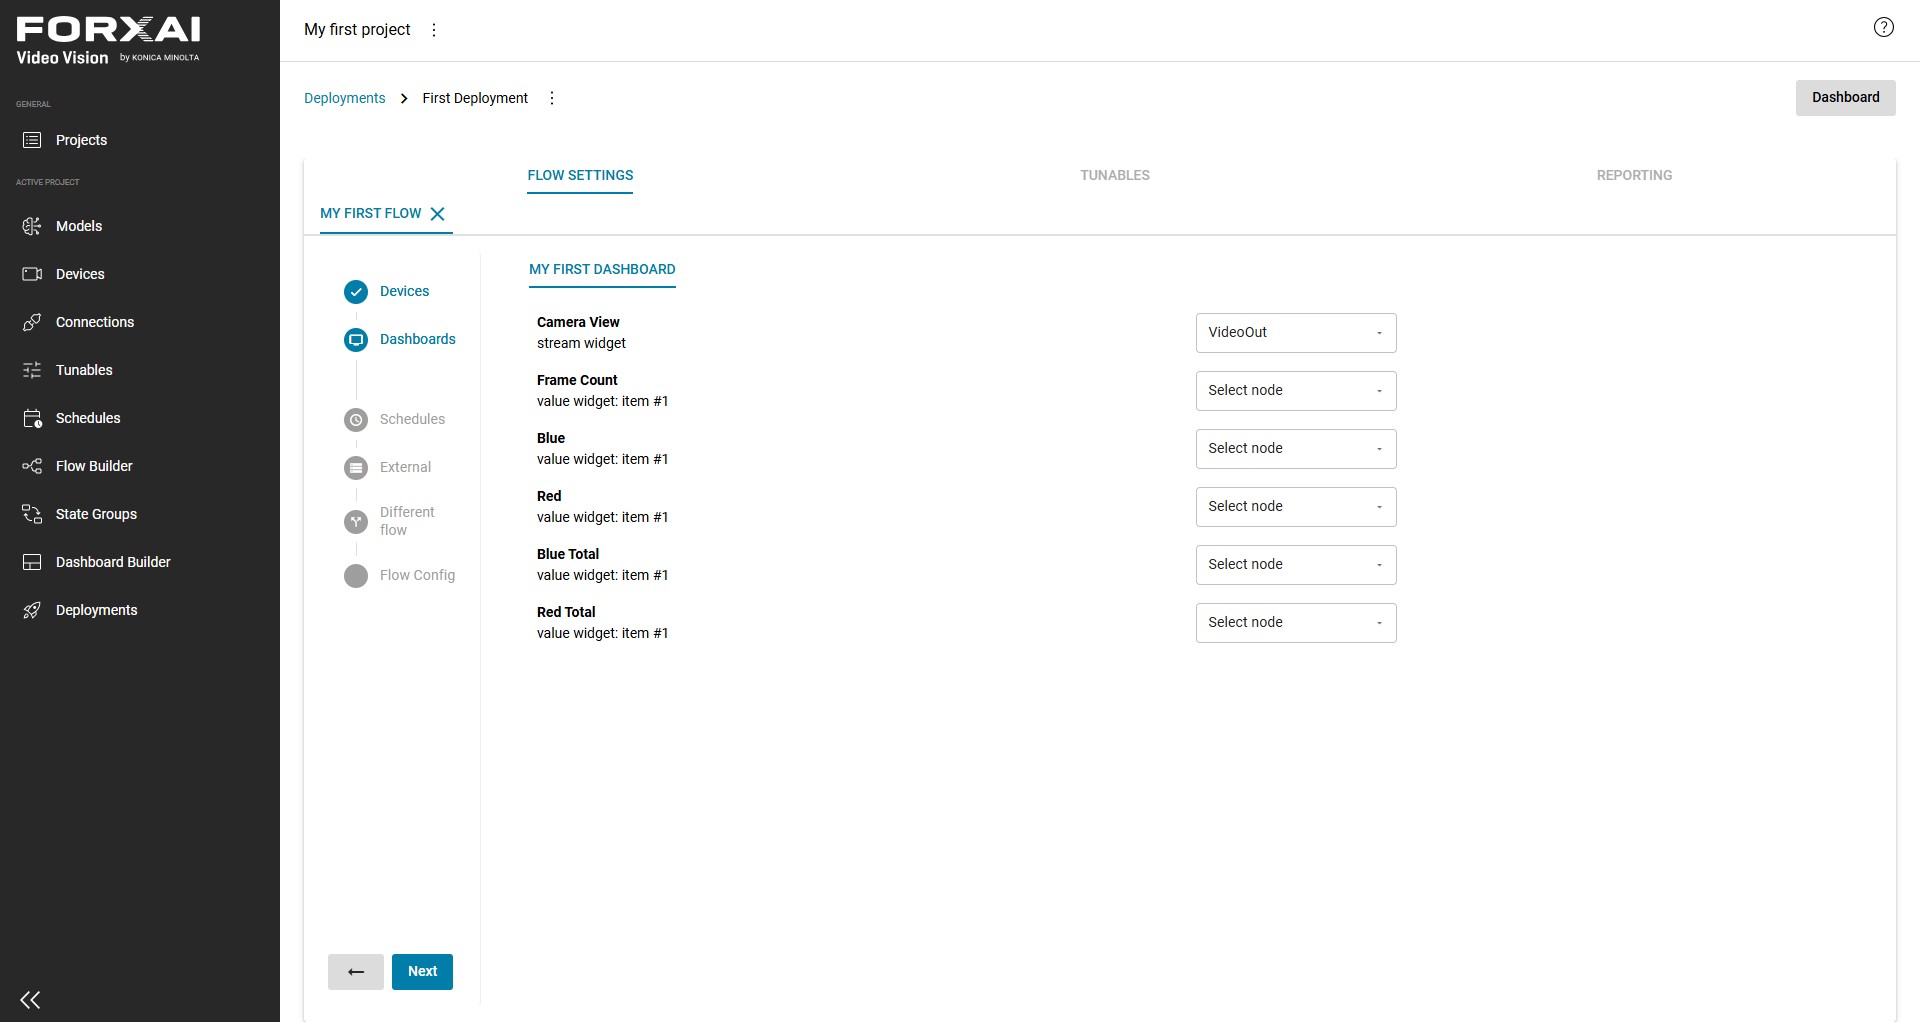
- Click
Next. The configuration switch to the configuration of theDashboard's connection. - Associate the
Camera Viewwidget with theVideoOutnode.
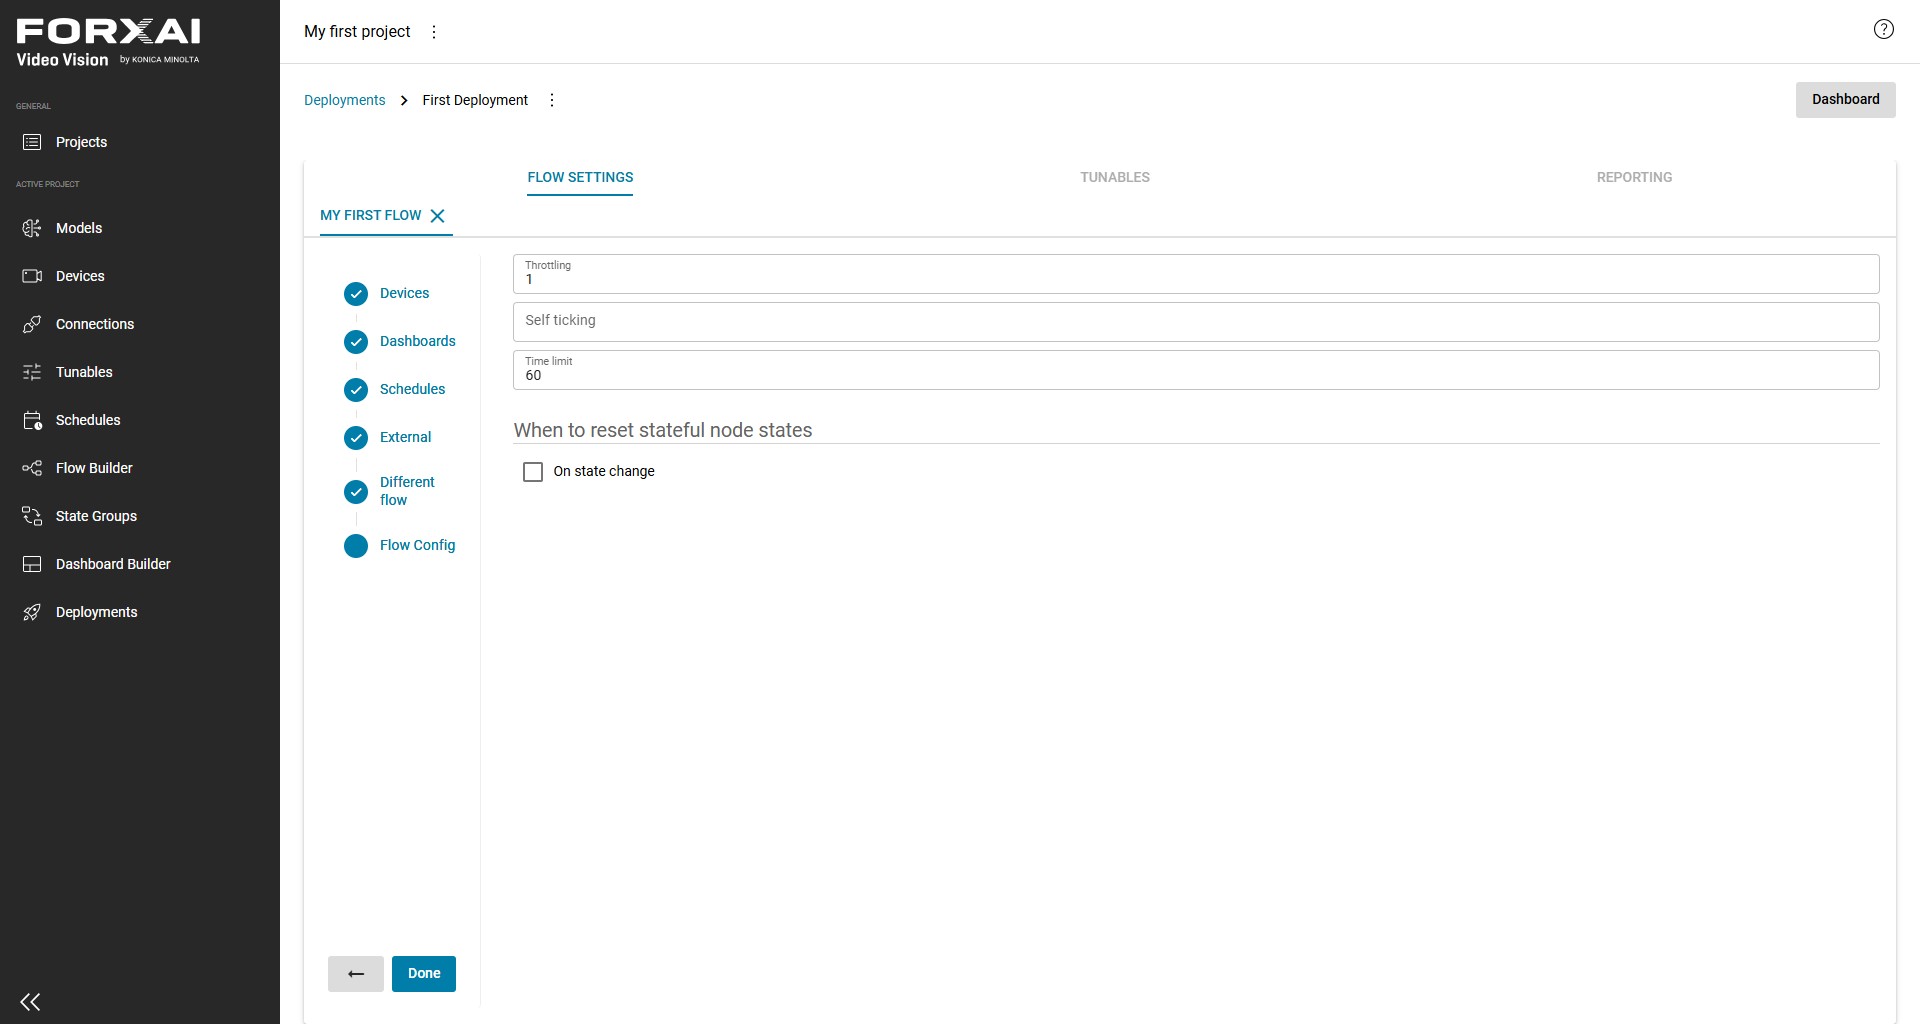
- Click on
Flow Config, then click onDone
Step 6 - Start the deployment and visualize results
You are now ready to start the deployment and check the output.
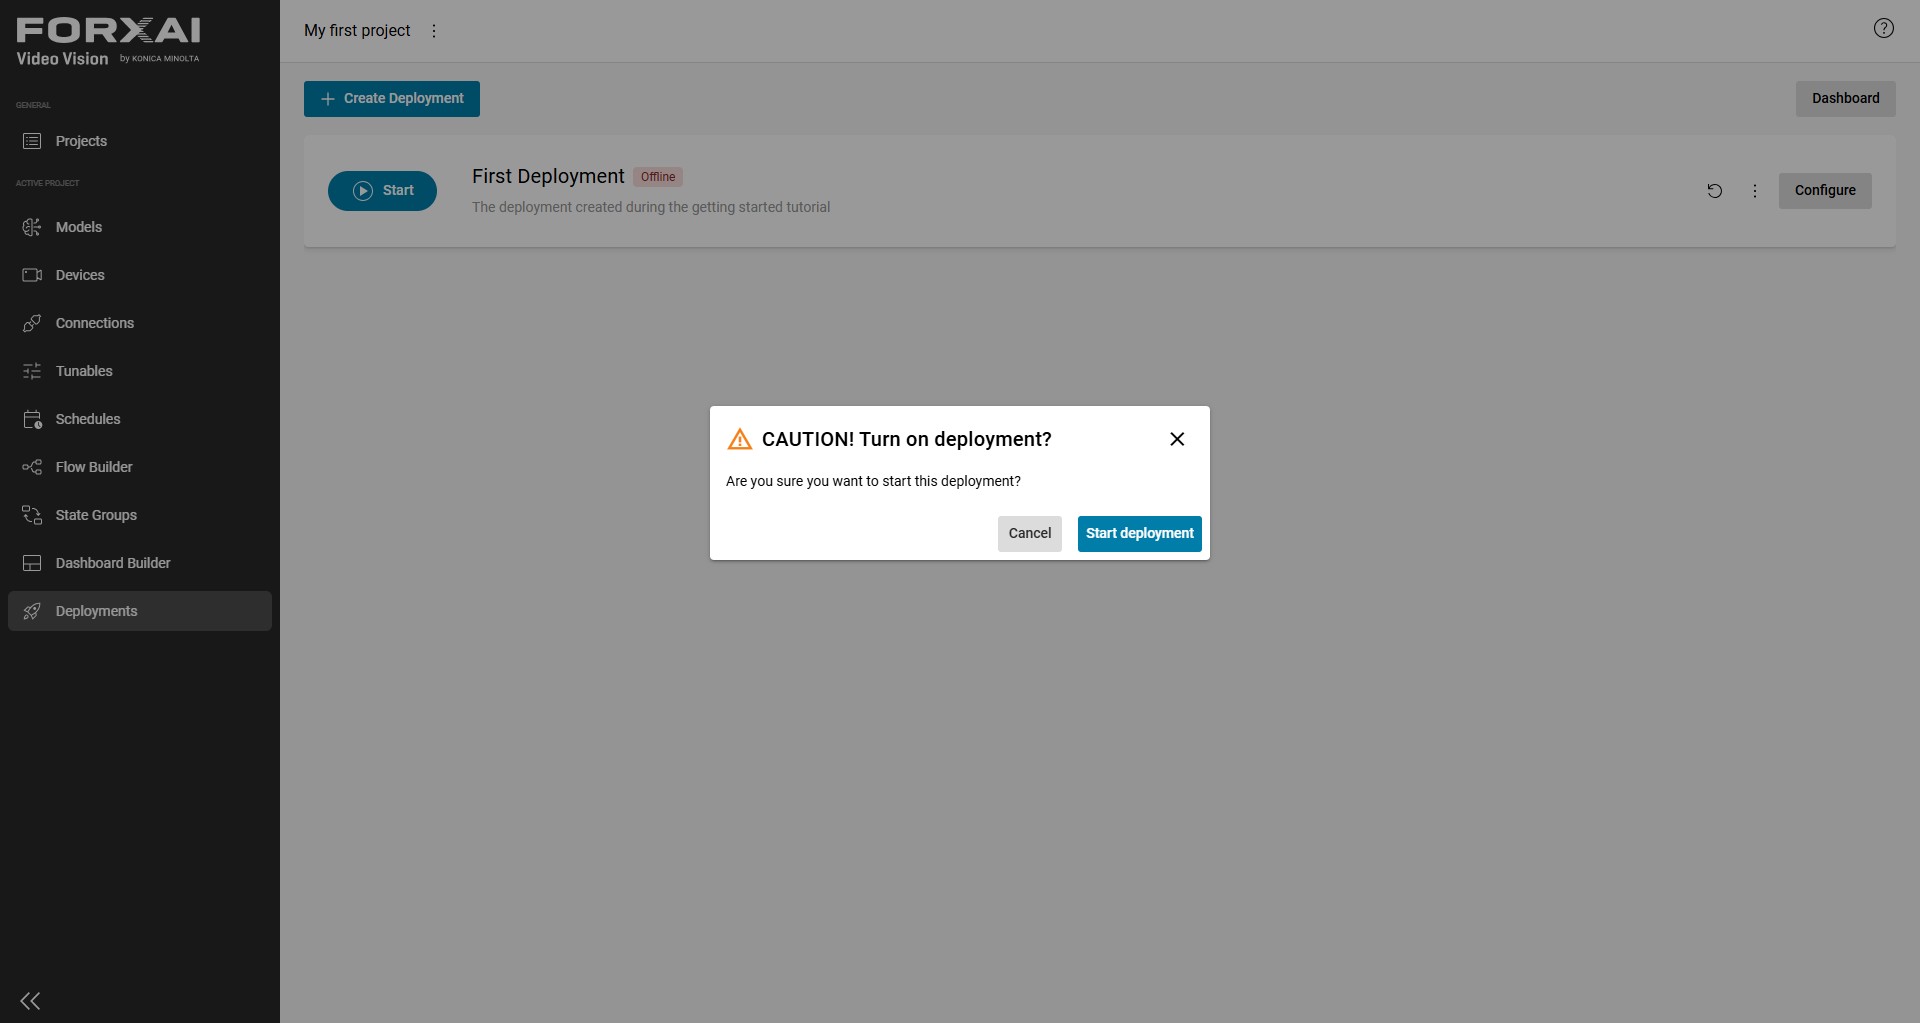
- Click on
Startto start the deployment. - in the
CAUTIONmessage, click onStart deploymentto confirm your intention to start the deployment.
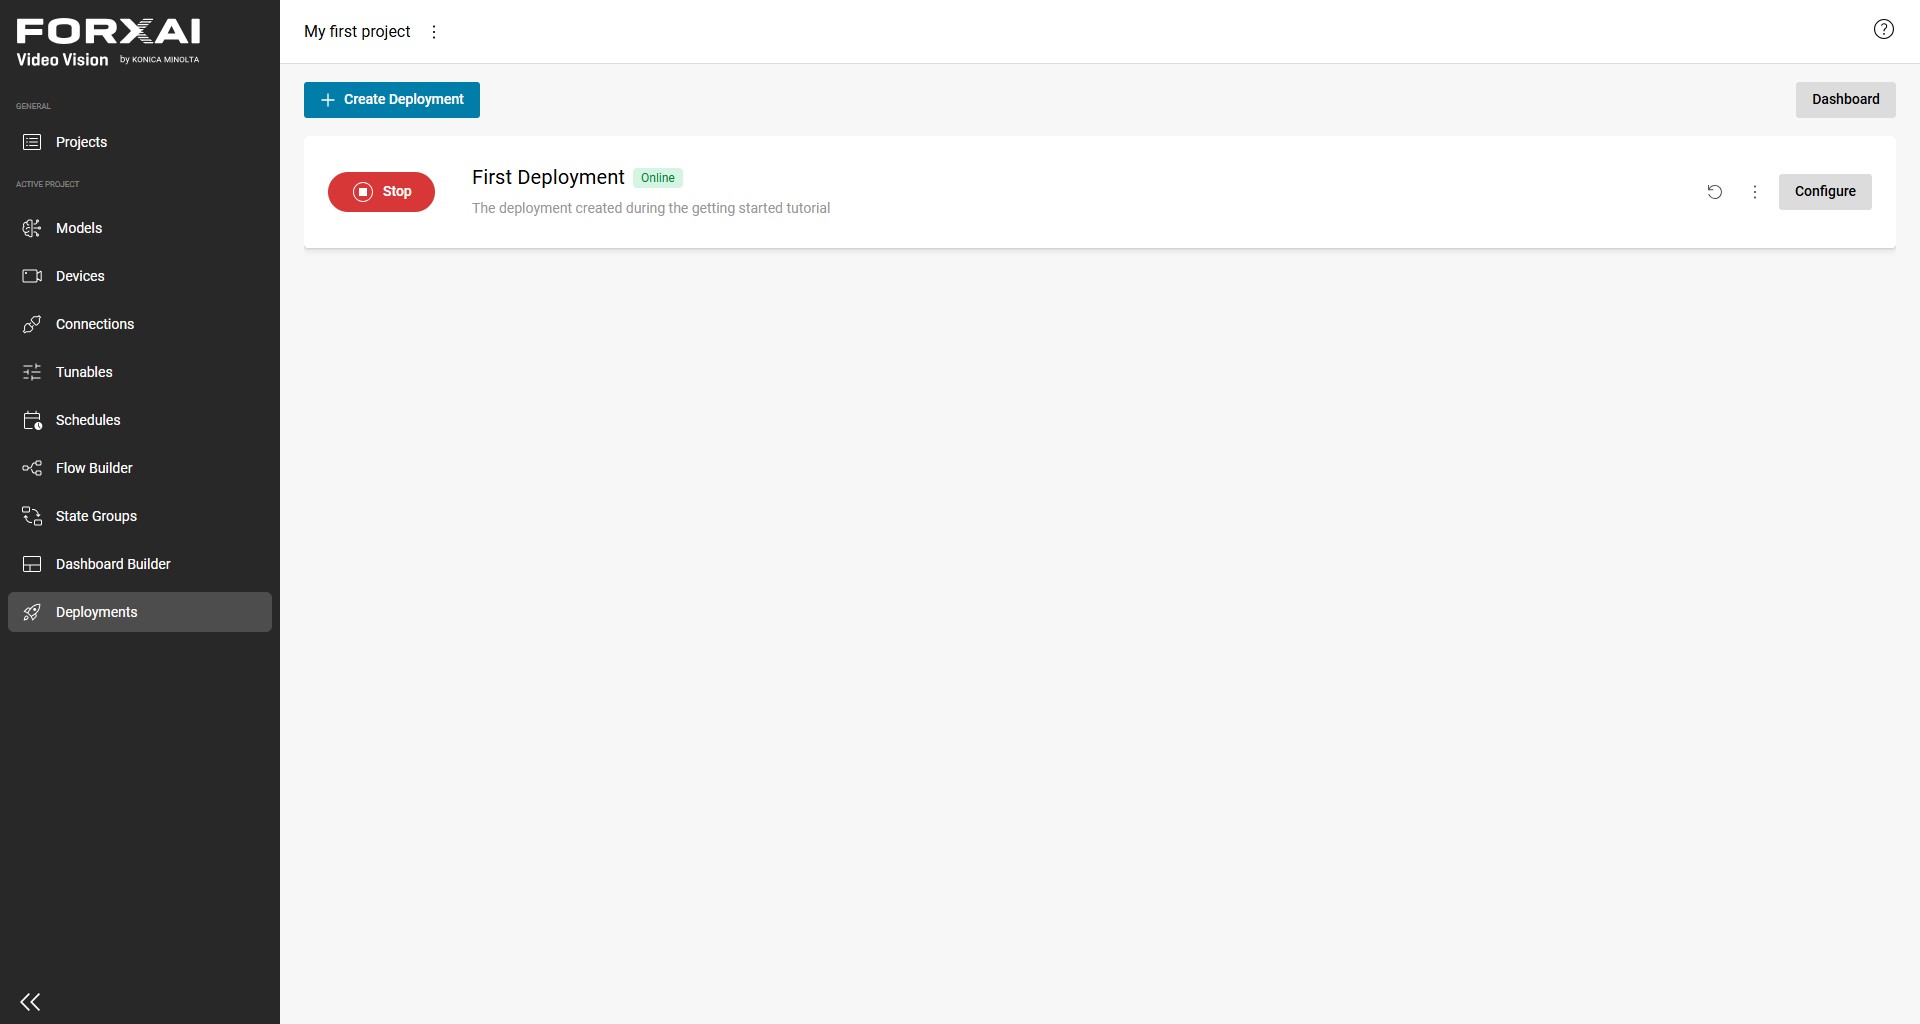
- The deployment is started.
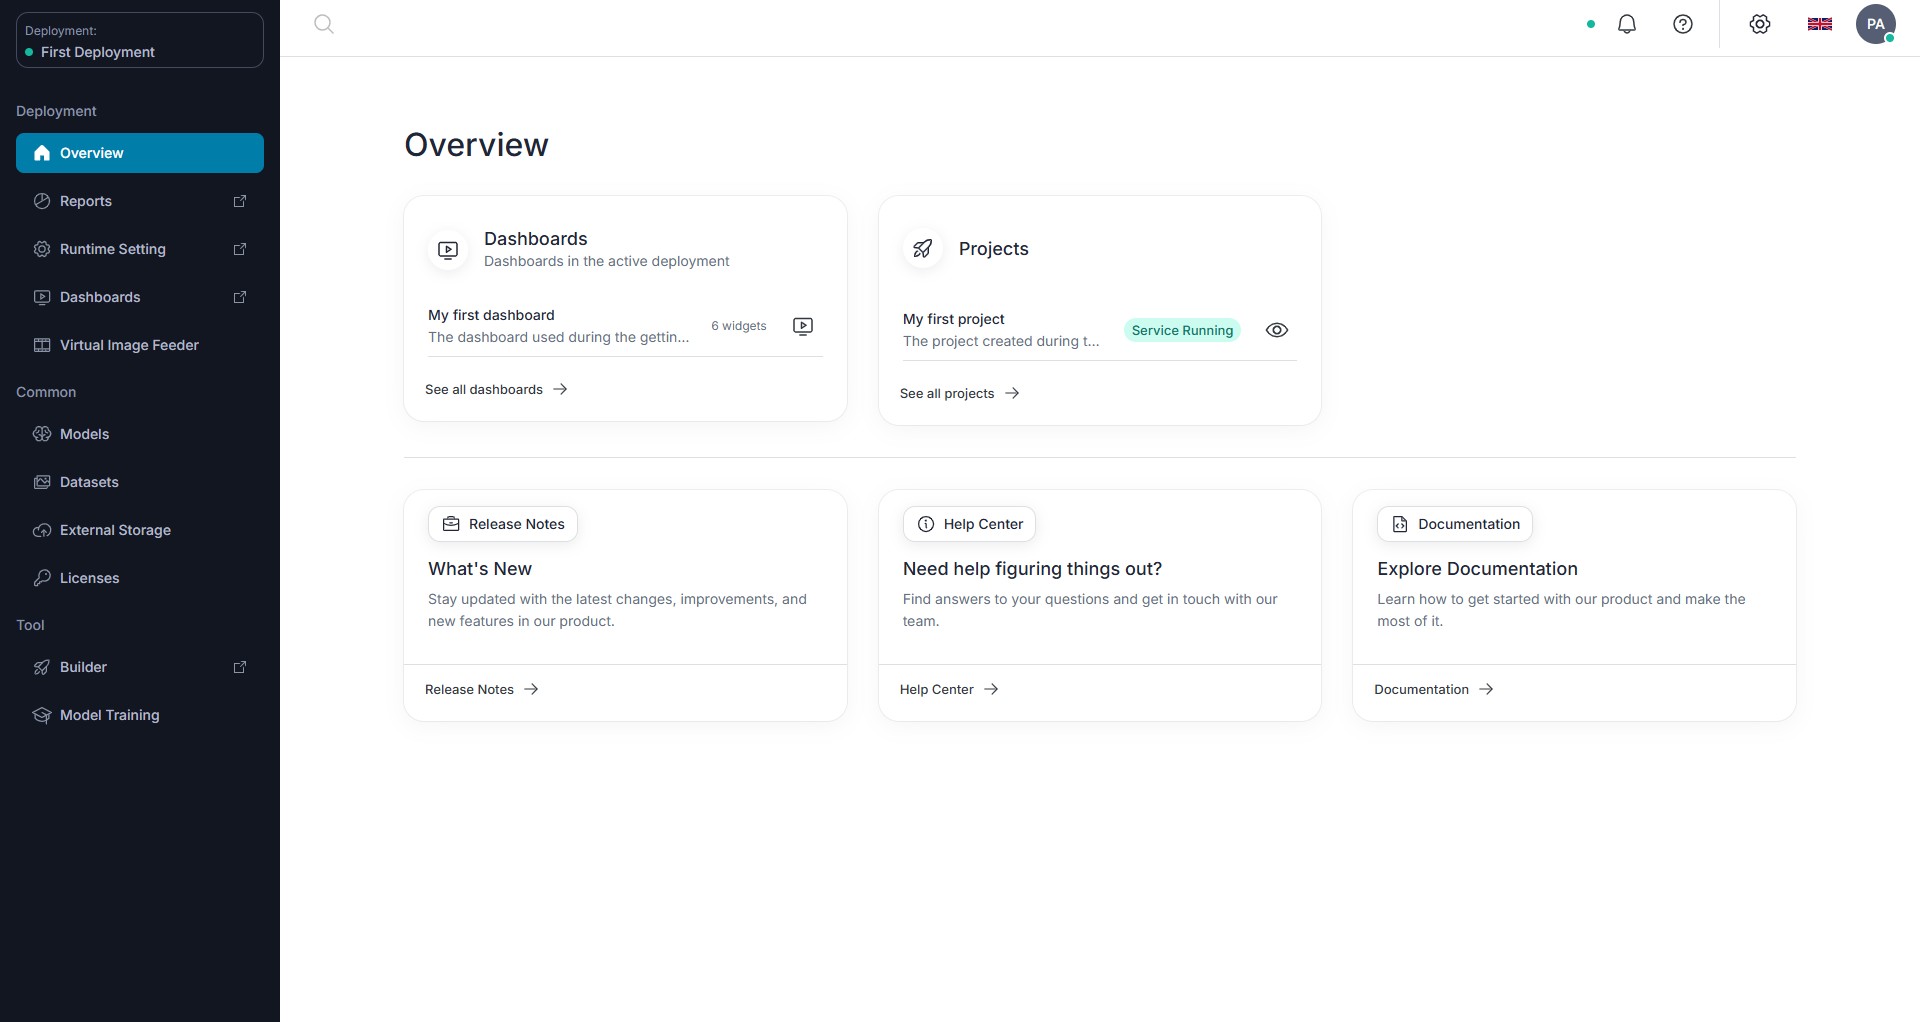
- Now switch back to the
Hubinterface. Go to theOverviewpage to see the current status of your running deployment.
- Click on
Virtual Image Feederon the sidebar. - Associate the
Cam01device with the datasetMy first dataset
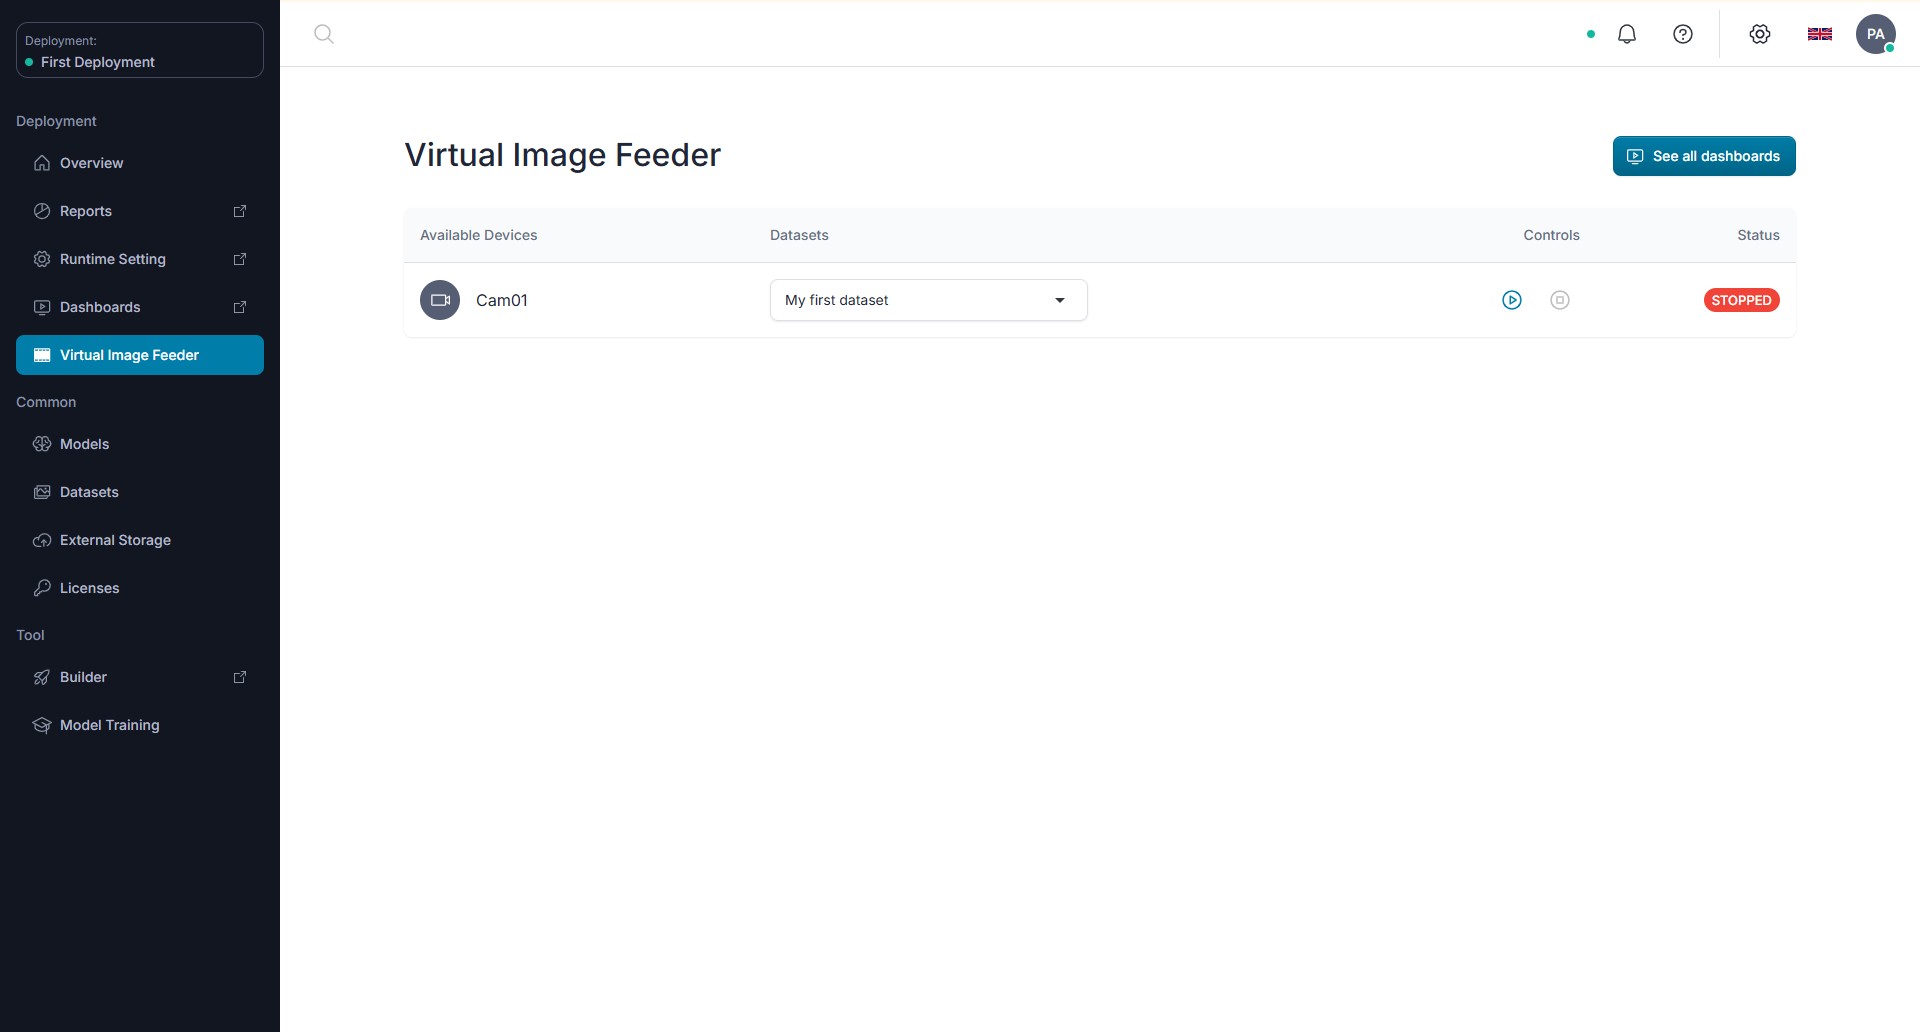
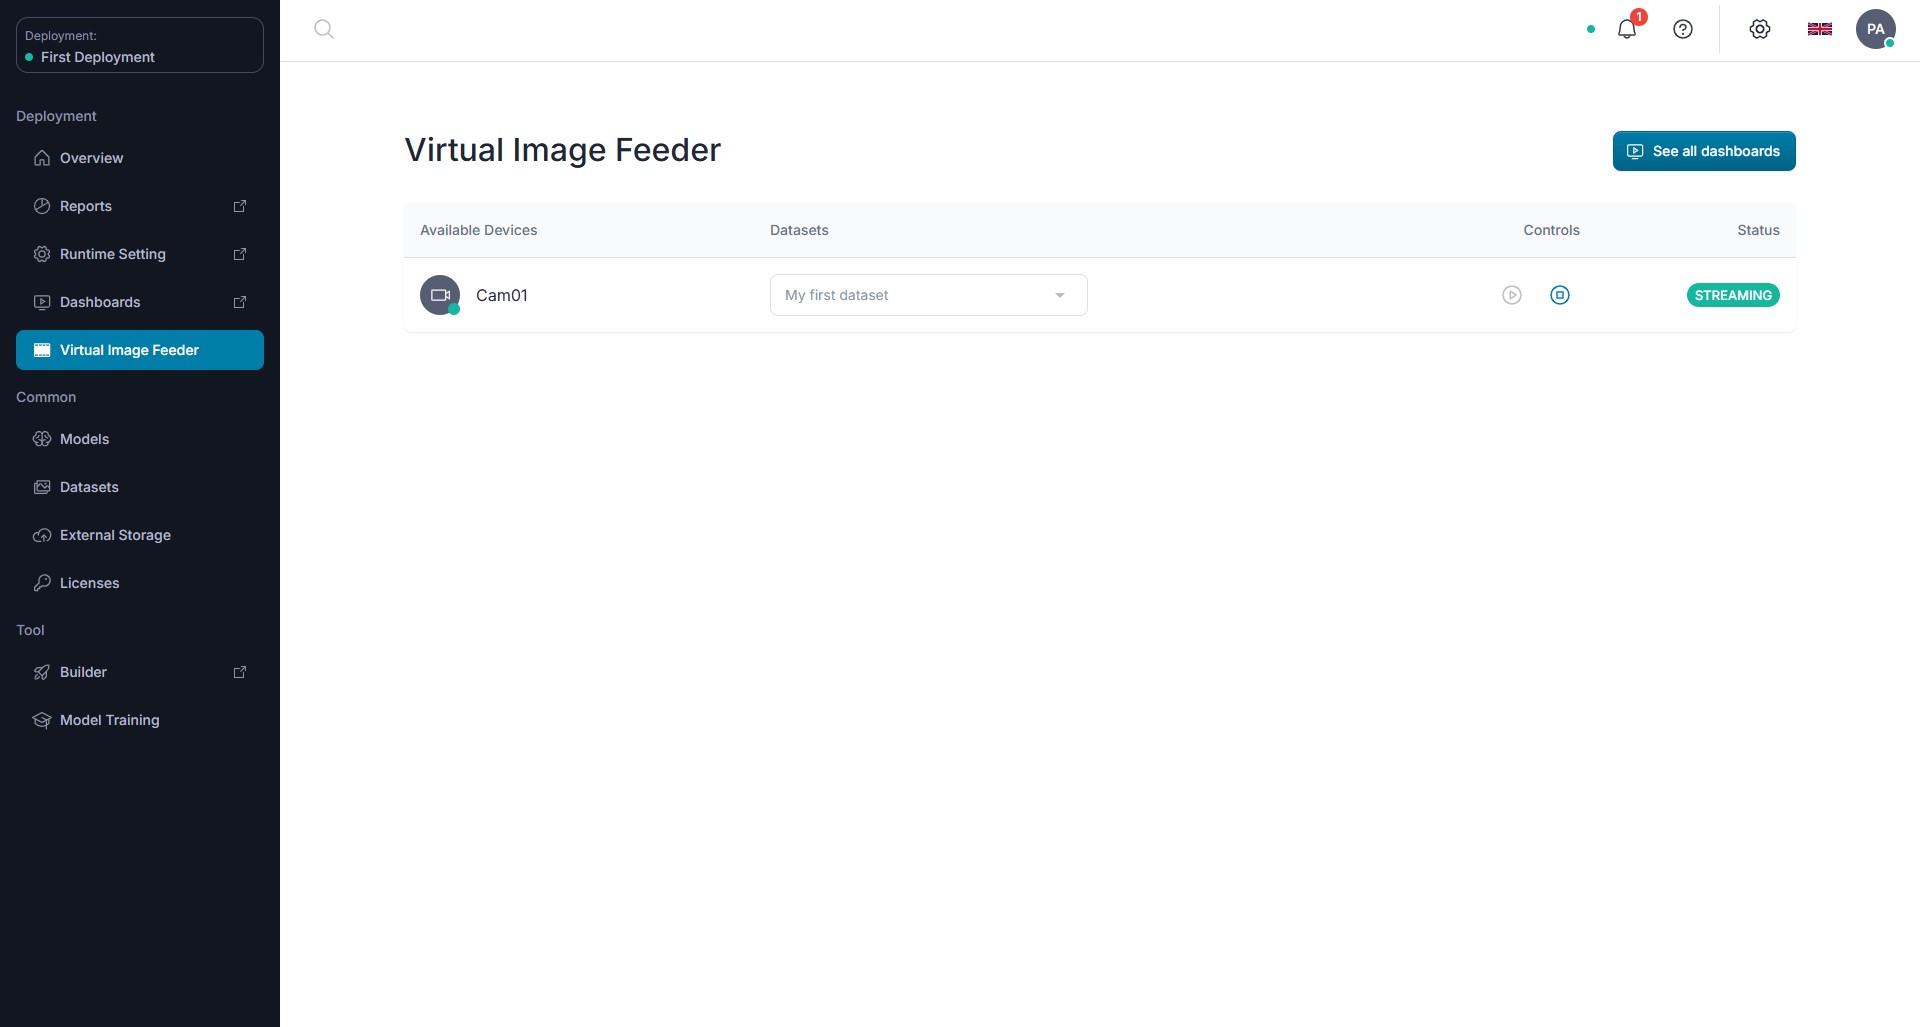
- Click on the
Starticon to start the camera. The camera will start streaming.
- Click on
Dashboardson the sidebar.
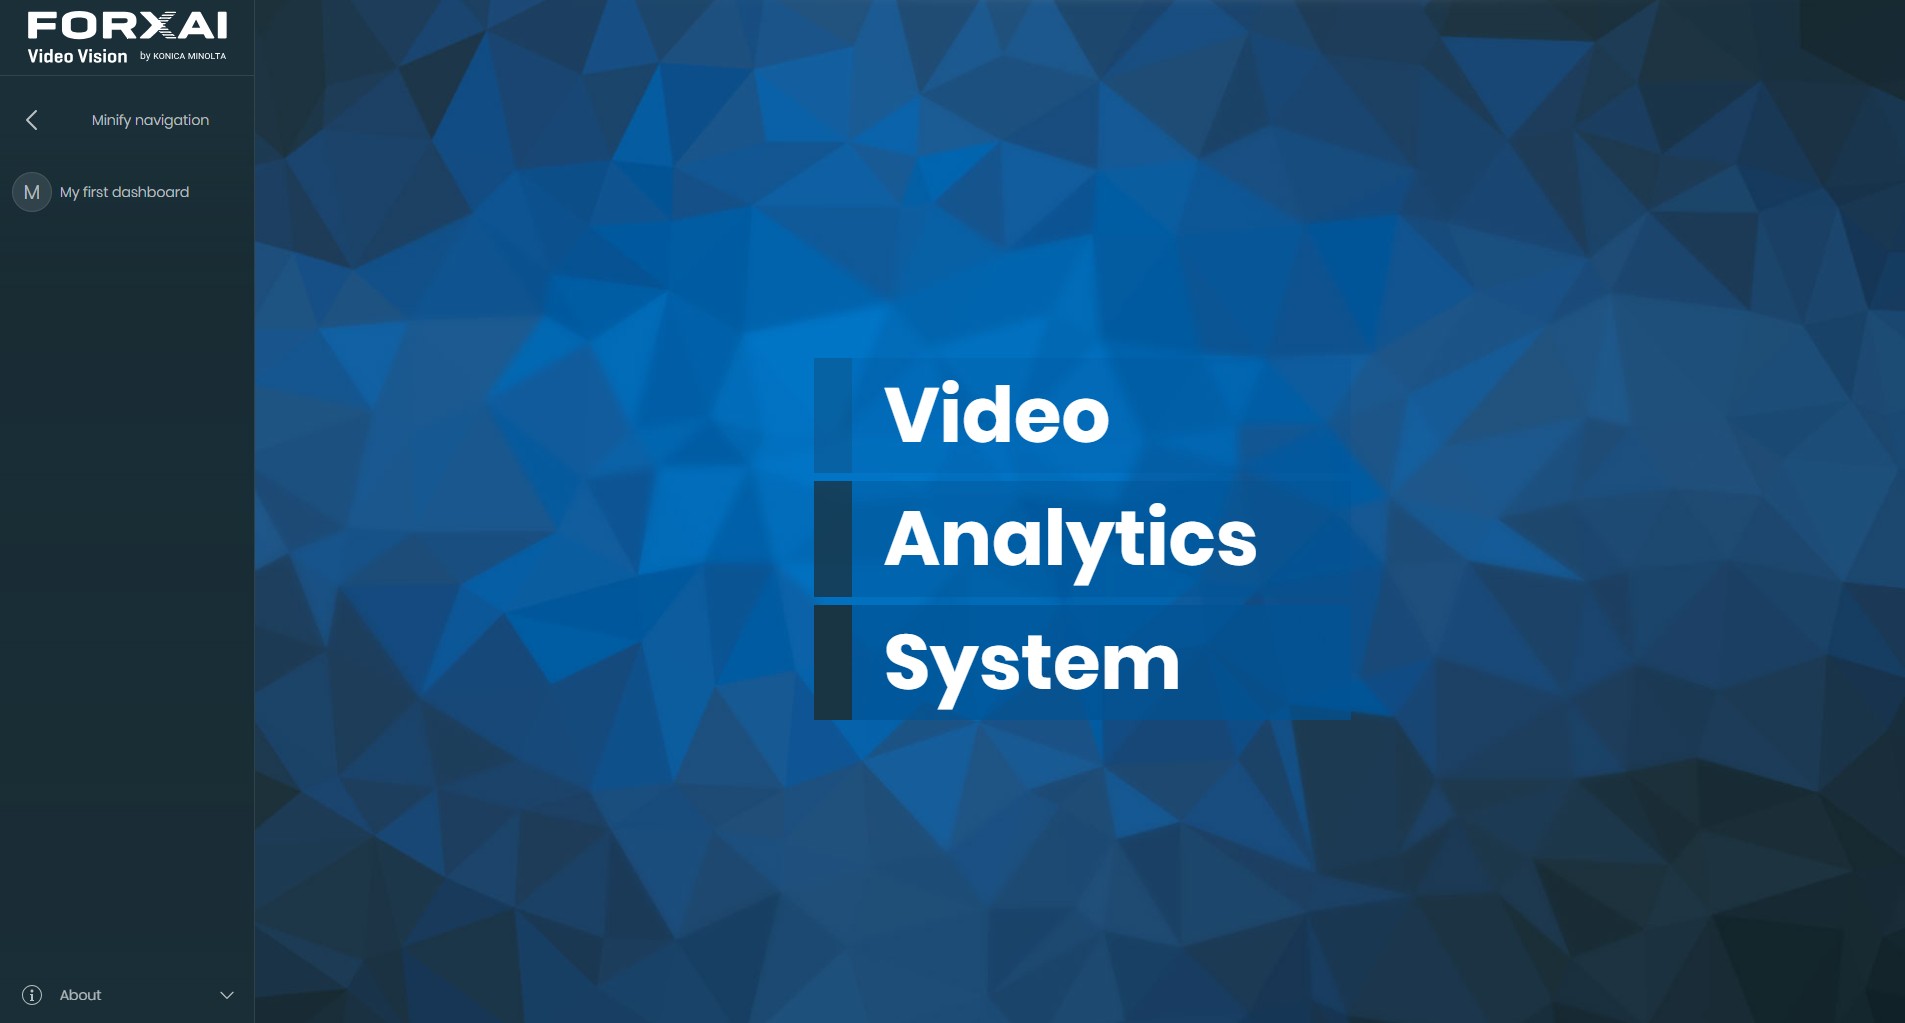
- Click on
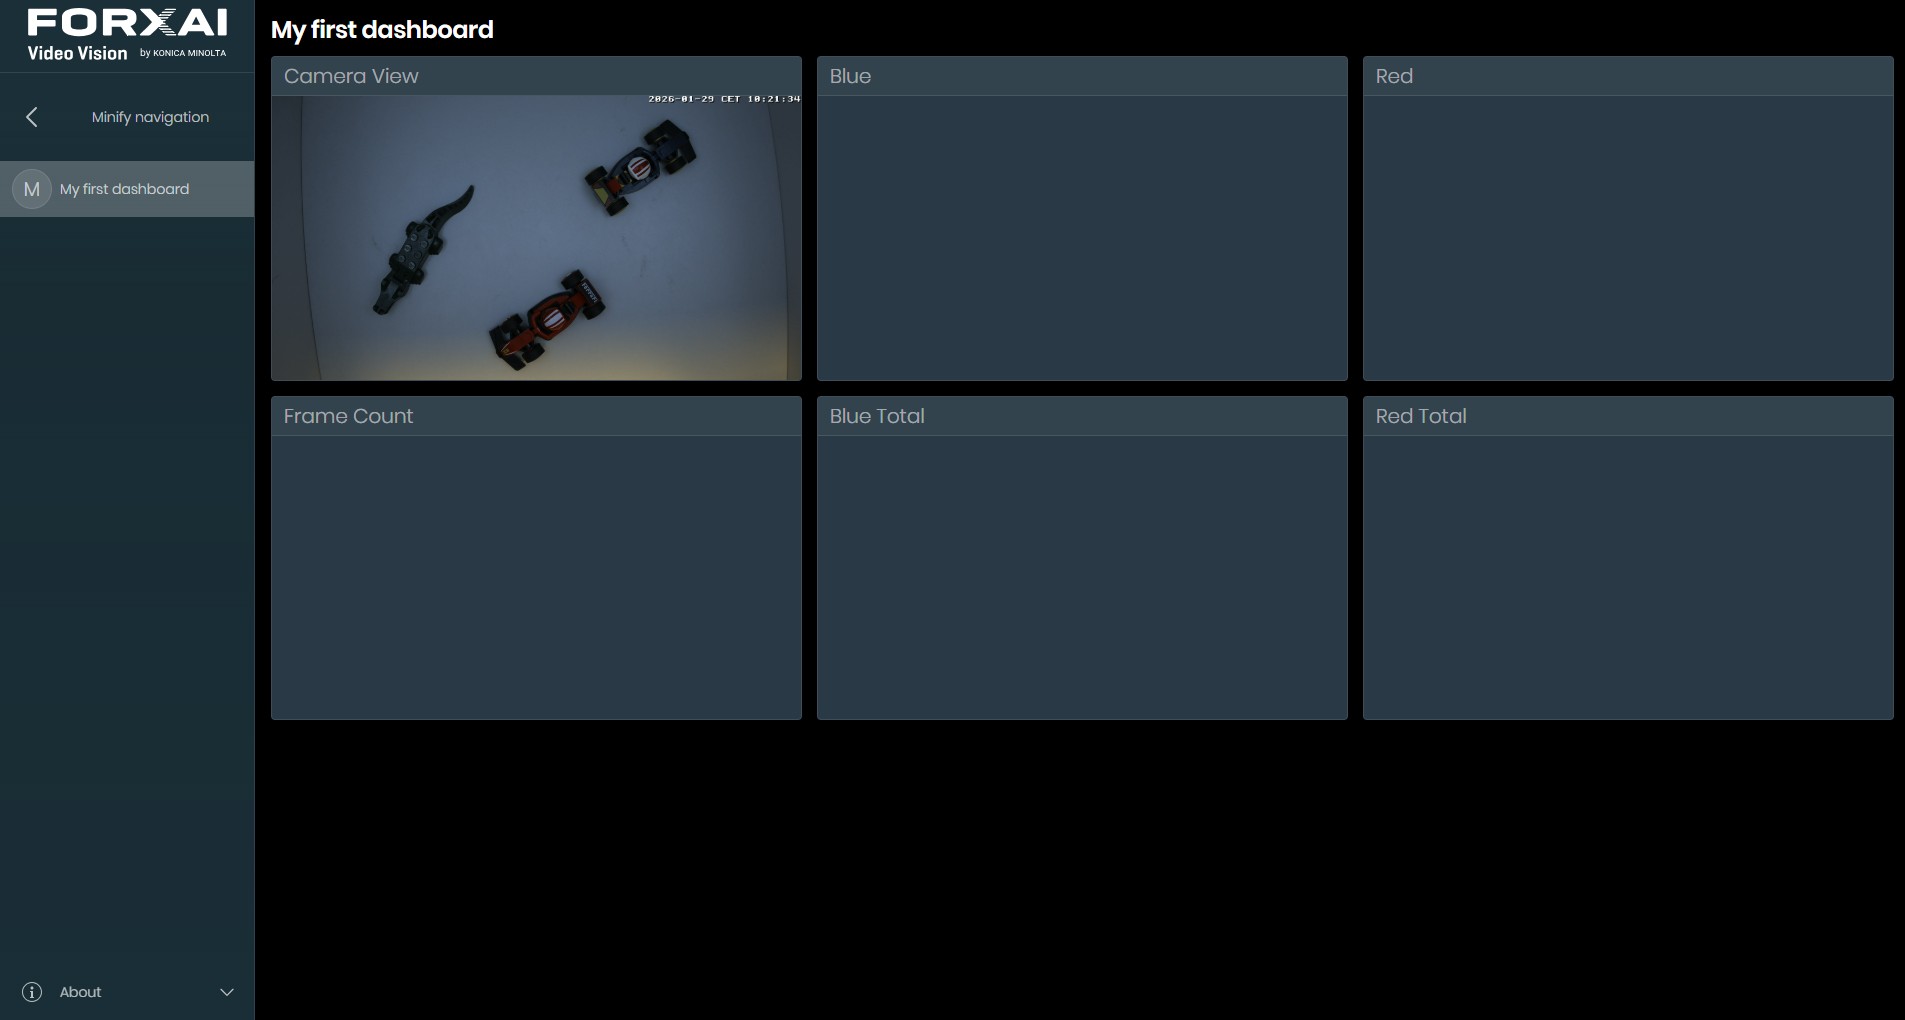
My first dashboardon the list of available dashboards. - Your dashboard appears and you will see a video stream in the
Camera Viewwidget.
Step 7 - Add a ML Model to the flow
The next step will be to add a model to the flow. Your goal is to detect blue and red cars in the images, and draw a blue and red box around them.
- Switch to the
Flow Builder - Click on
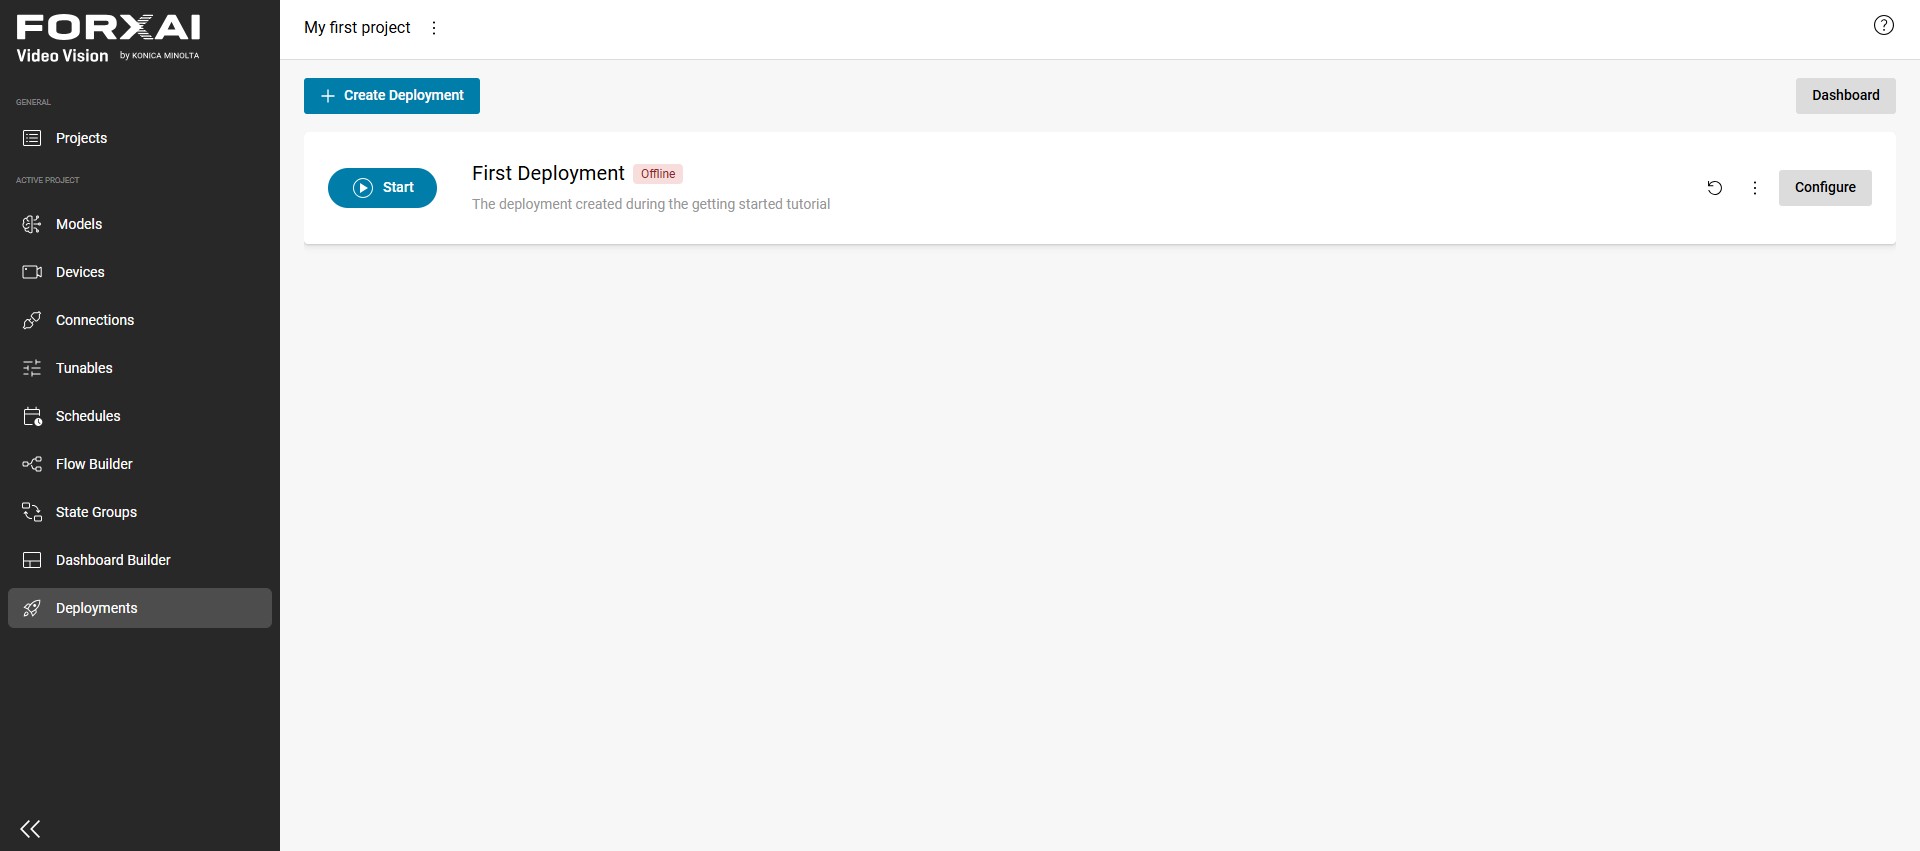
Deployments - Click on
Stopto stop the running deployment - In the
CAUTIONmessage, click onStop deploymentto confirm your choice.
- Click on
Models - Click on
Add model to project - Click on
From remote store - In the
Remote models listdialog:- Select
km-public-modelin theCustomer list - Select
OD_1920x1080_Formula1 (version: 1)in theSelect Model
- Select
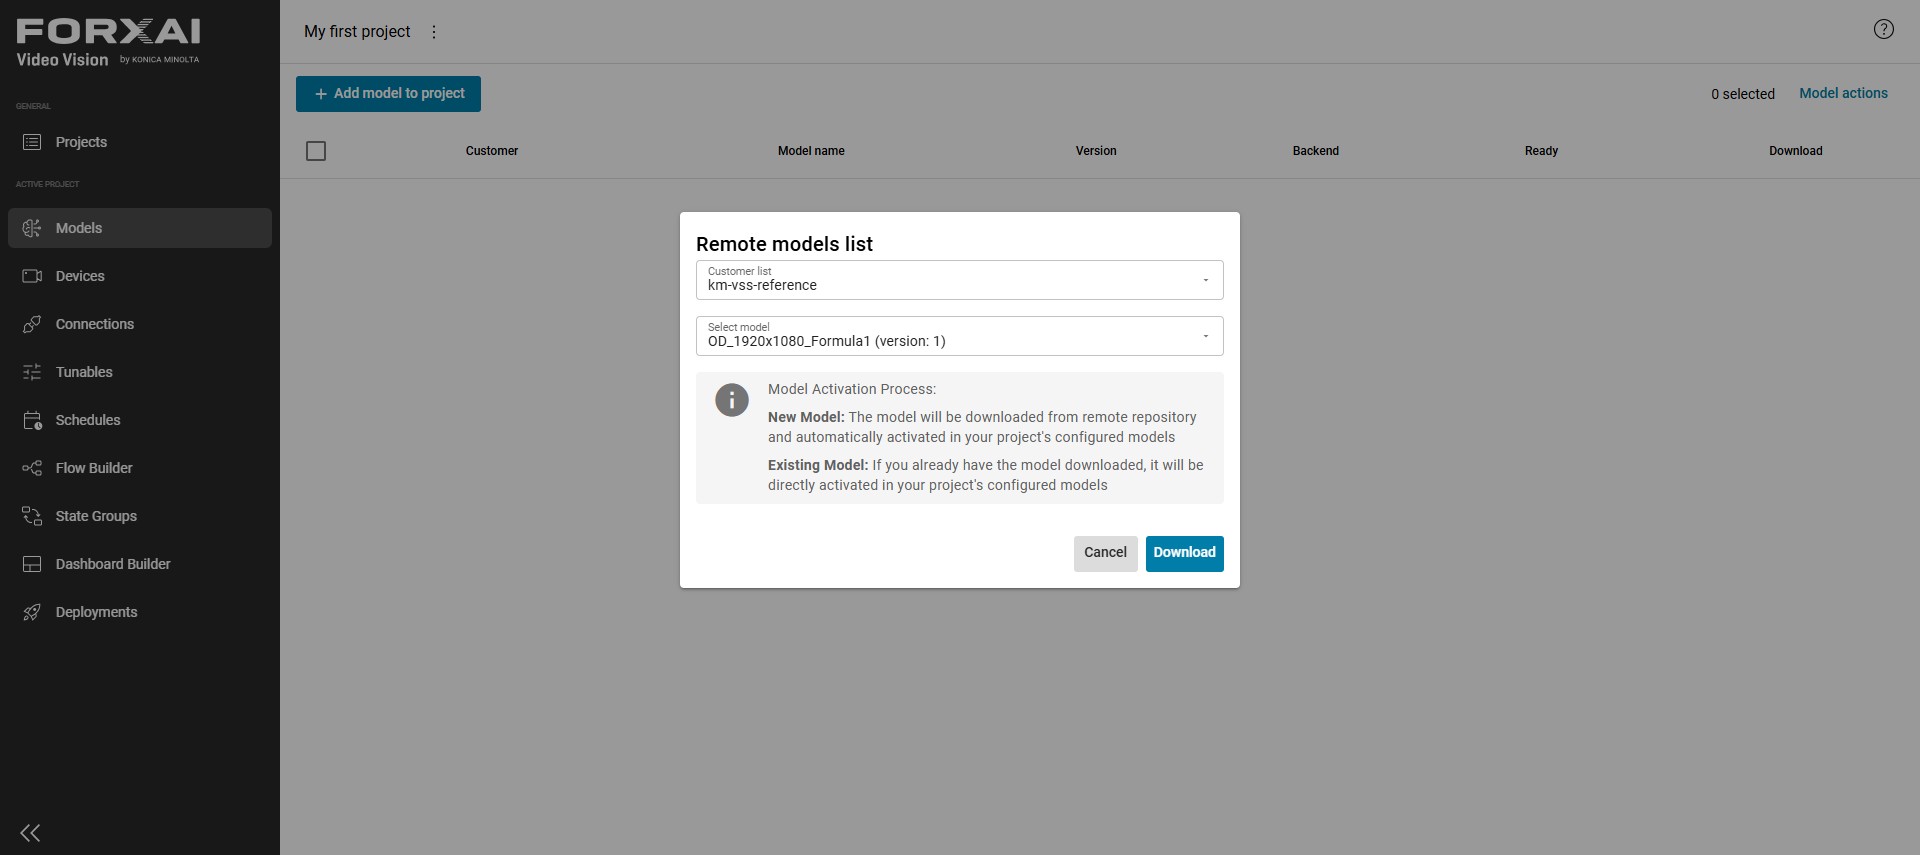
- Click on
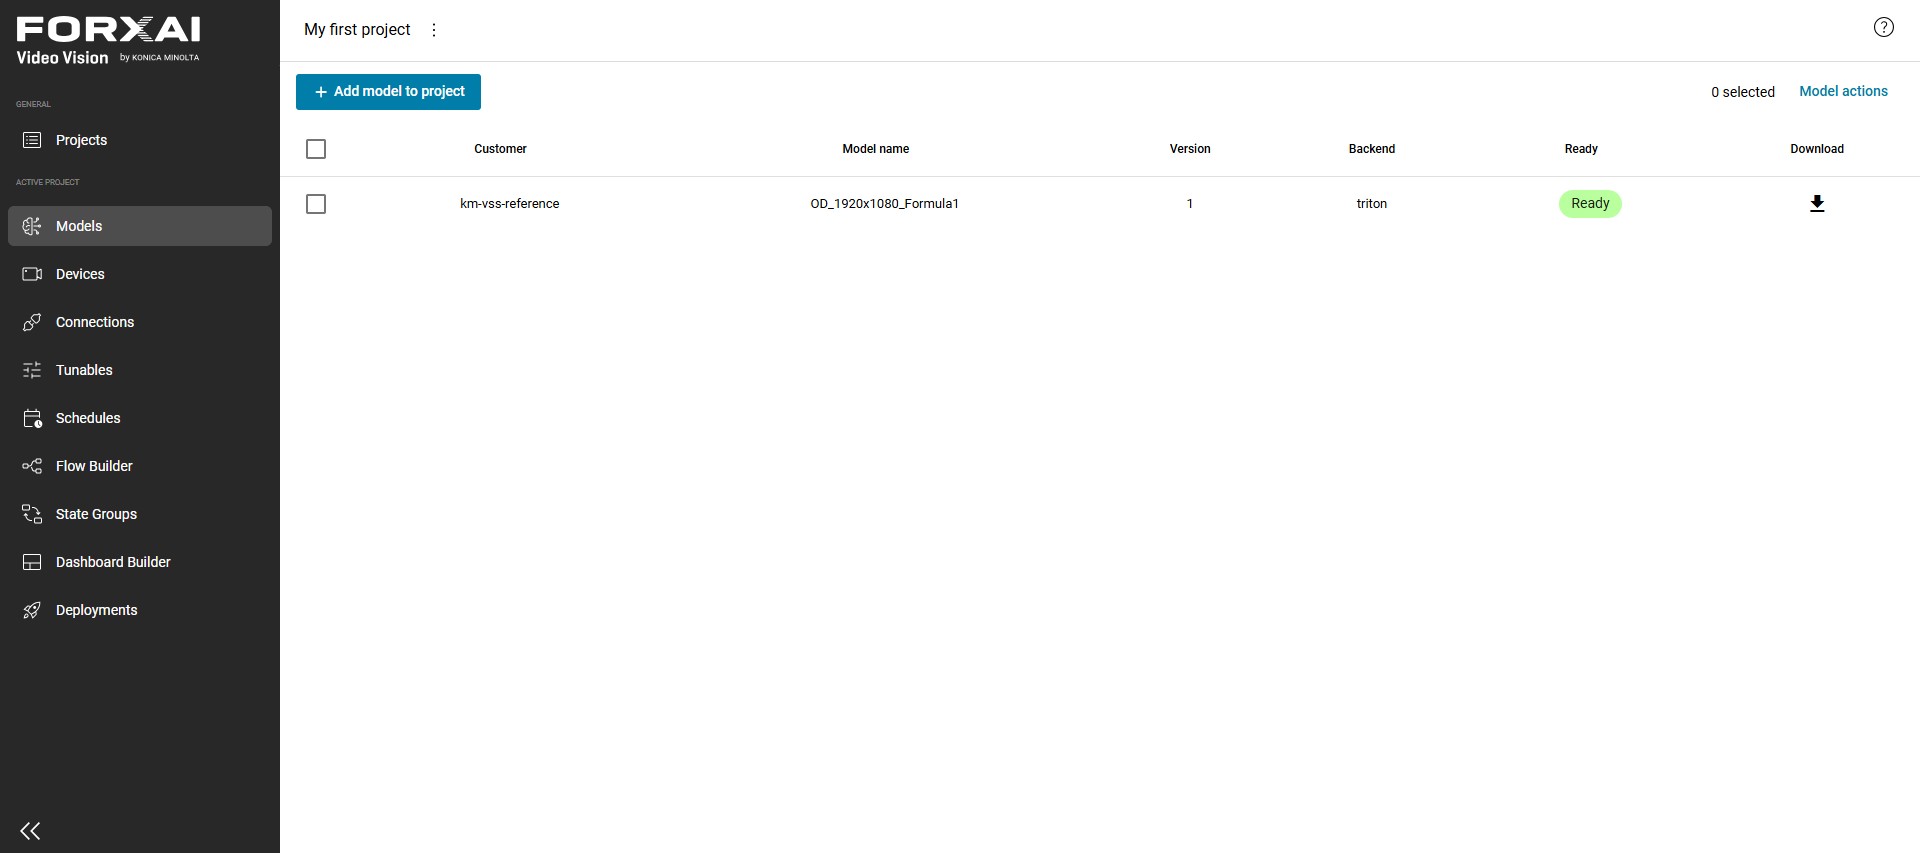
Download - The model is downloaded in the local model store and is now ready to be used in a flow.
- Click on
Flow Builder - From the
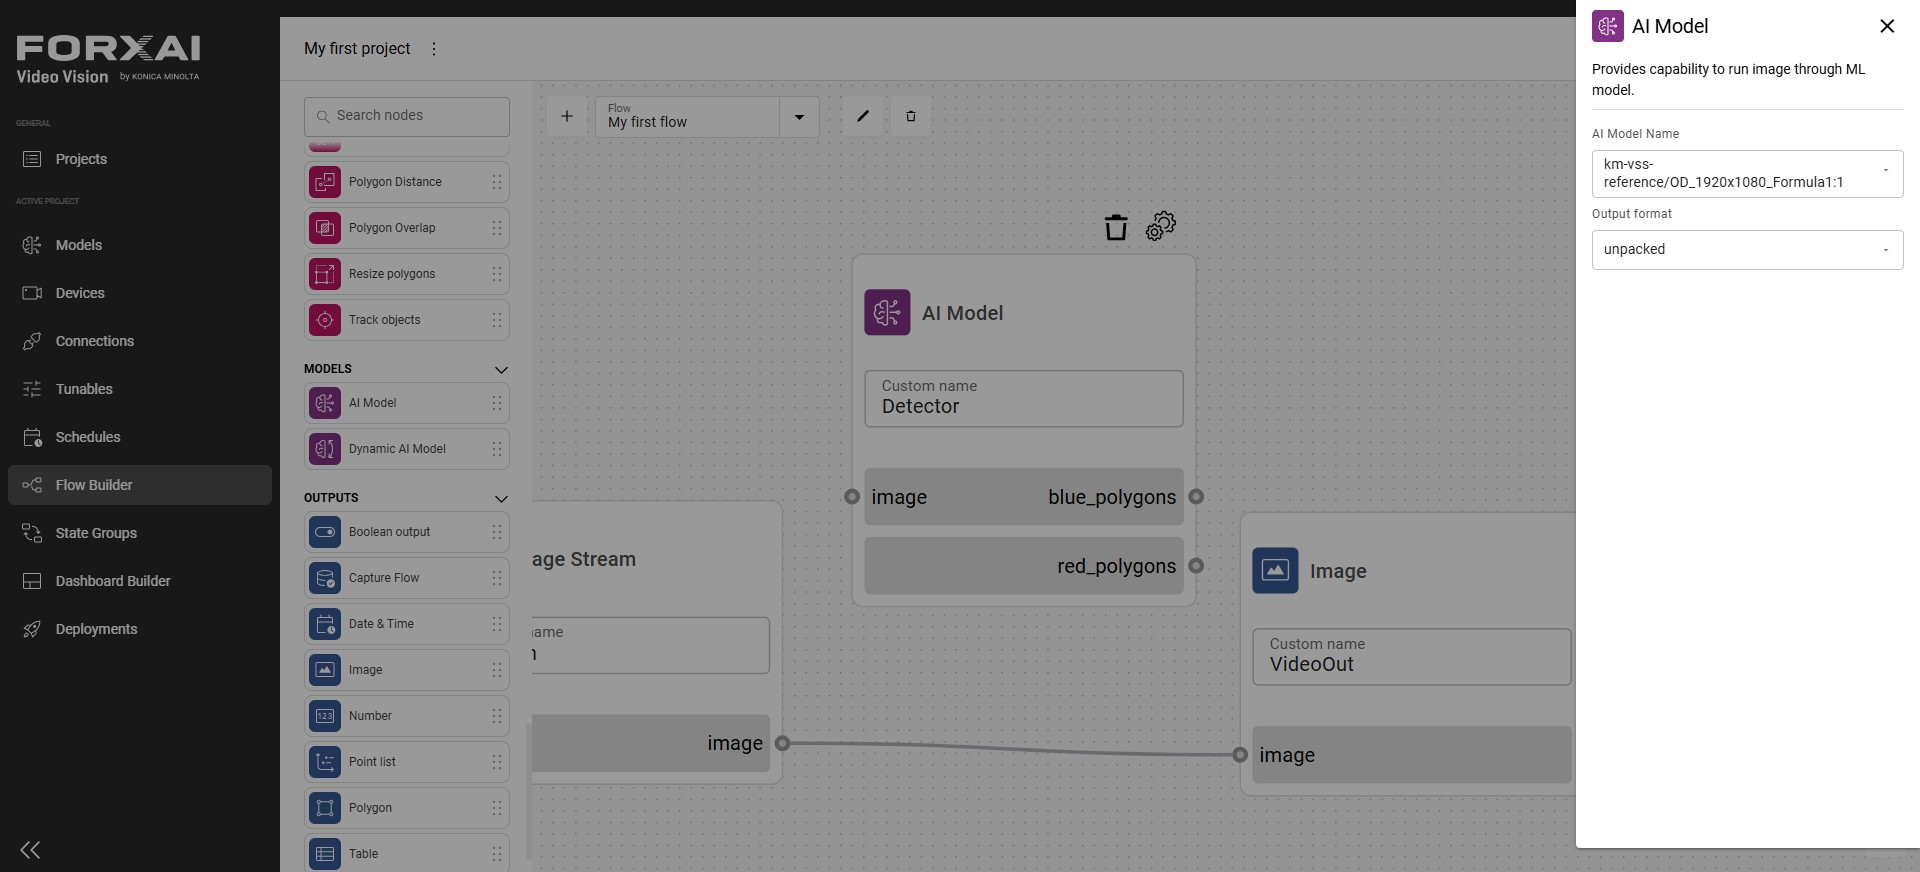
MODELSgroup, add theAI Modelto the flow. Name itDetector - Click on the cog icon on the top right corner of the flow. In the node configuration panel:
- Select
km-public-model/OD_1920x1080_Formula1:1in theAI Model Name - Select
unpackedin theOutput format
- Select
- Click on the
Xto close the node configuration panel. - From the
MODEL PROCESSORSgroup, add twoAnnotate polygonsnode to the flow. Name them:BluePolRedPol
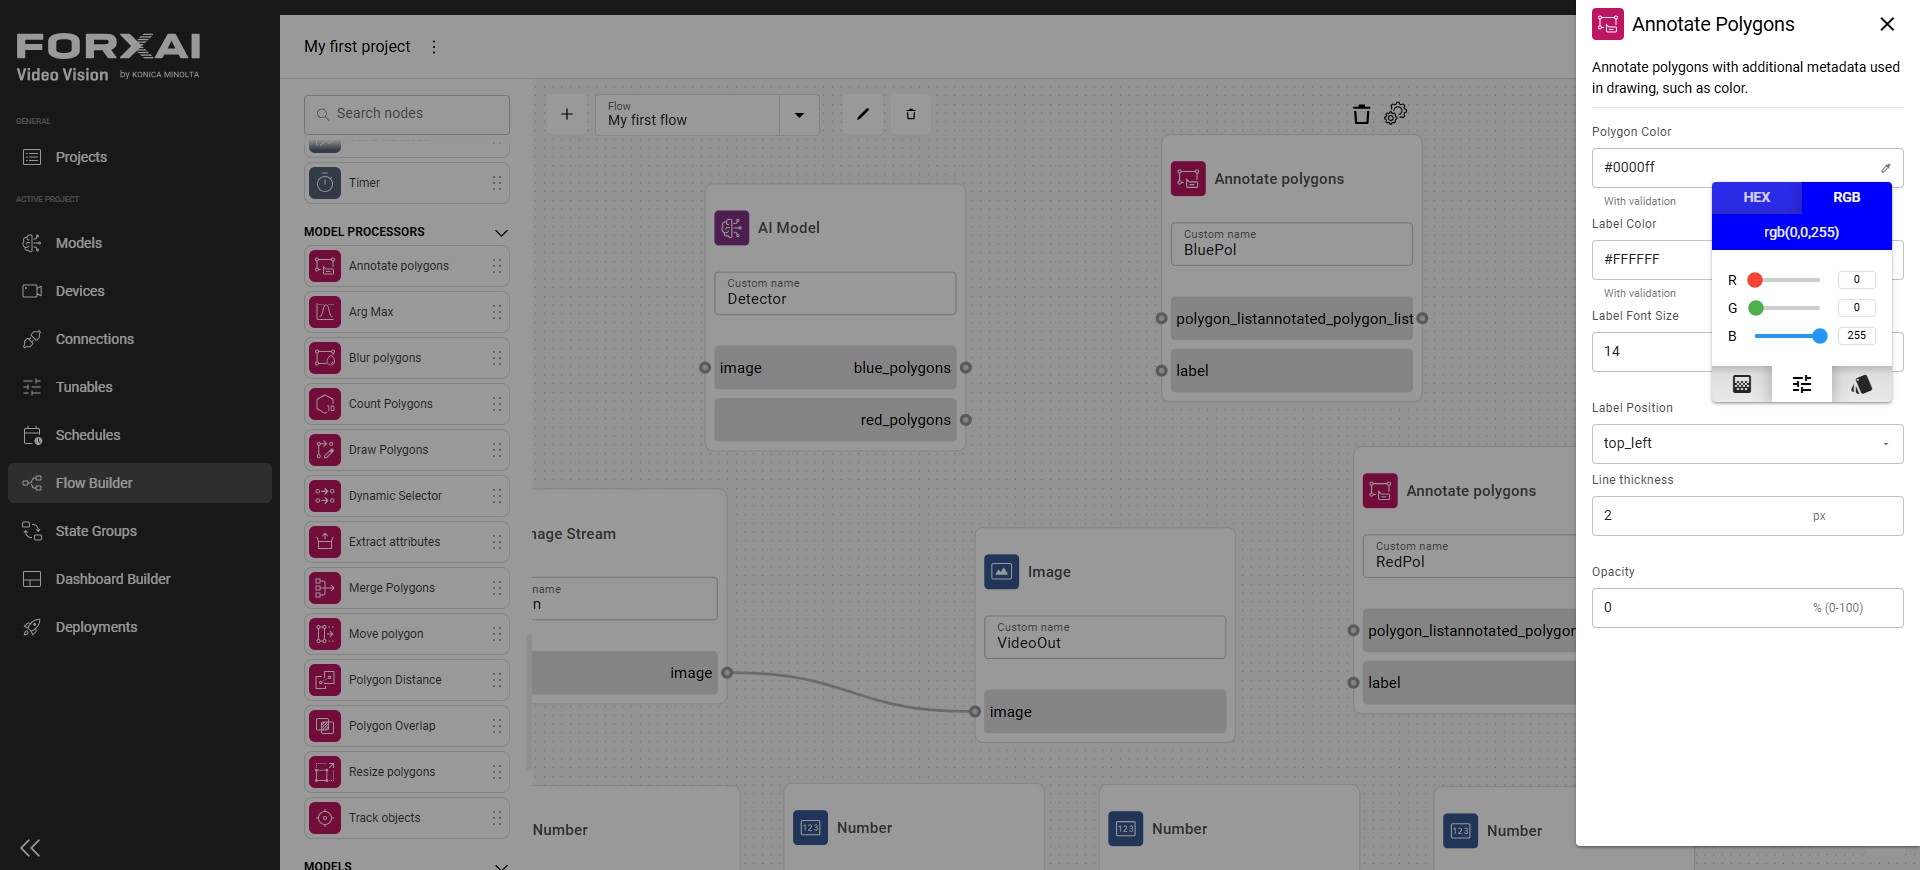
- Click on the cog icon of
BluePol - Use the color picker to configure
Polygon Colorto blue.
- Configure the
Polygon ColorofRedPolto red. - Connect the
blue_polygonsoutput of theDetectornode to thepolygon_listinput of theBluePolnode. - Connect the
red_polygonsoutput of theDetectornode to thepolygon_listinput of theRedPolnode. - From
MODEL PROCESSORgroup, add aMerge Polygonsnode to the flow. Name itBlueRedPol. - Connect the output of
BluePolto the inputinput_polygons_0ofBlueRedPol - Connect the output of
RedPolto the inputinput_polygons_1ofBlueRedPol - From
MODEL PROCESSORgroup, add aDraw Polygonsto the flow. Name itAllPol. - Connect the output of
BlueRedPolto thepolygon_listinput ofAllPol - Click on the connection between
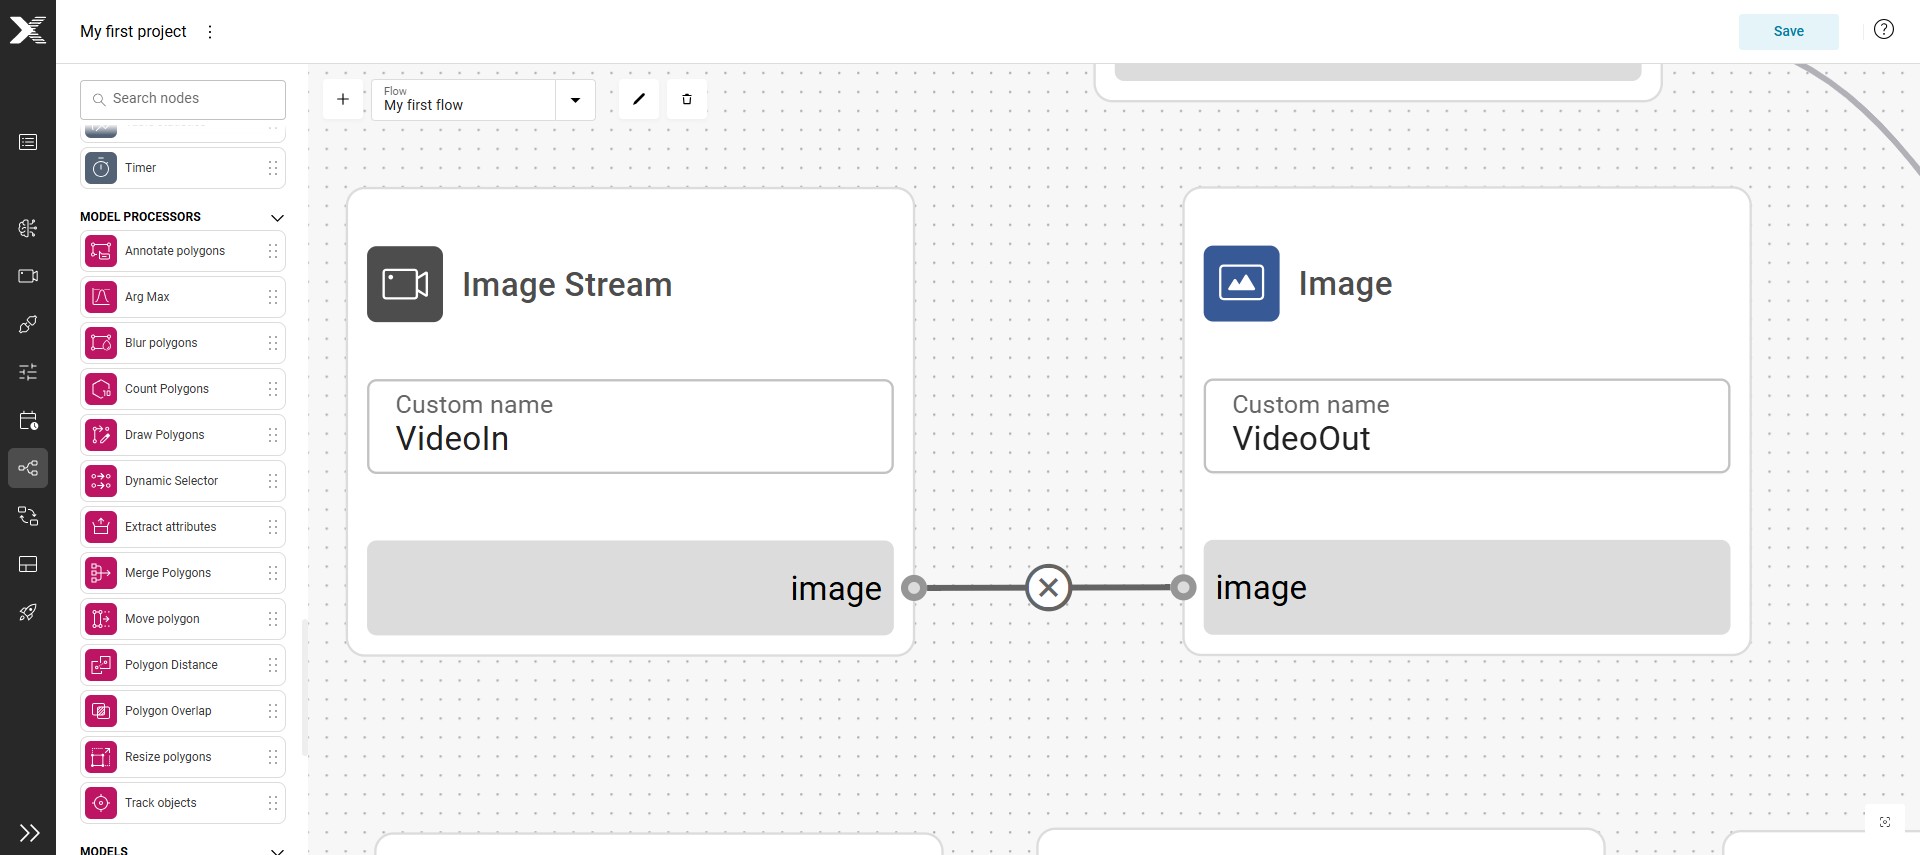
VideoInandVideoOut. Click on theXto remove the connection.
- Connect the output of
VideoInto theinput_imageofAllPol - From
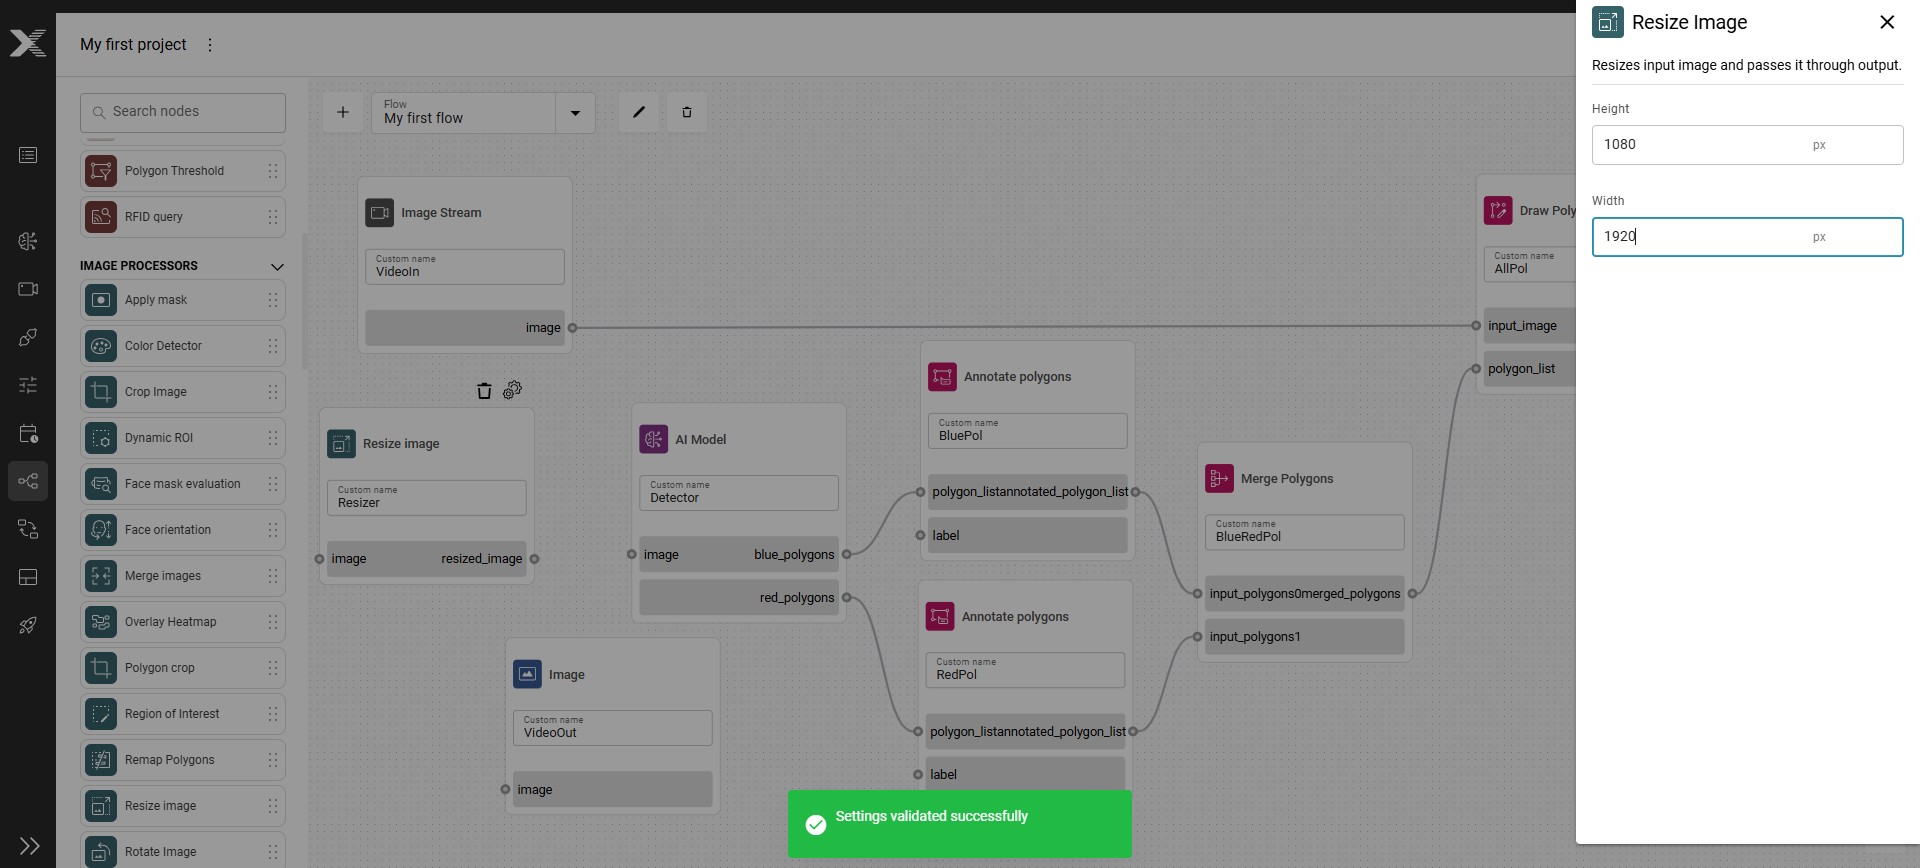
IMAGE PROCESSORSgroup, add aResize Imagenode to the flow. Name itResizer. In its configuration panel:- Set
Widthto 1920 - Set
Heightto 1080
- Set
- Conect the output of
Resizerto the input ofDetector - Connect the output of
VideoInto the input ofResizer - Connect the output of
AllPolto the input ofVideoOut - Click
Saveto store all these changes.
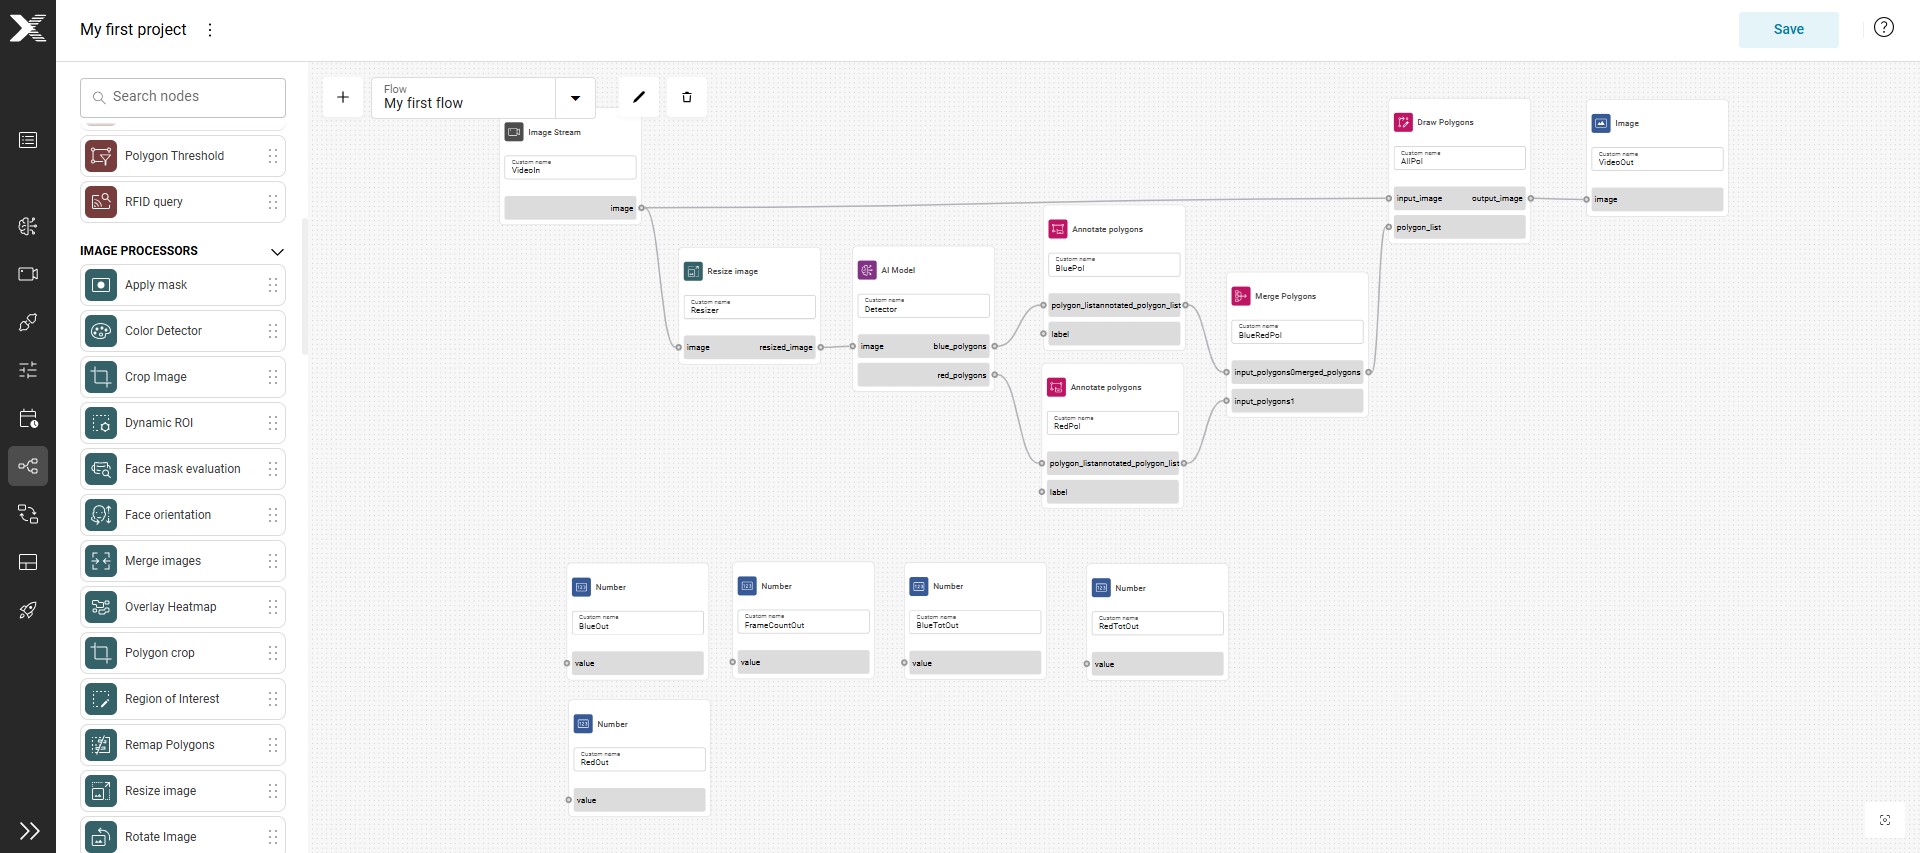
Your flow should now be like the one in the image below.
- Click on
Deploymentsand start theFirst Deployment - Go to the
Huband, in theVirtual Image Feeder, restart theCam01video feed. - Go on
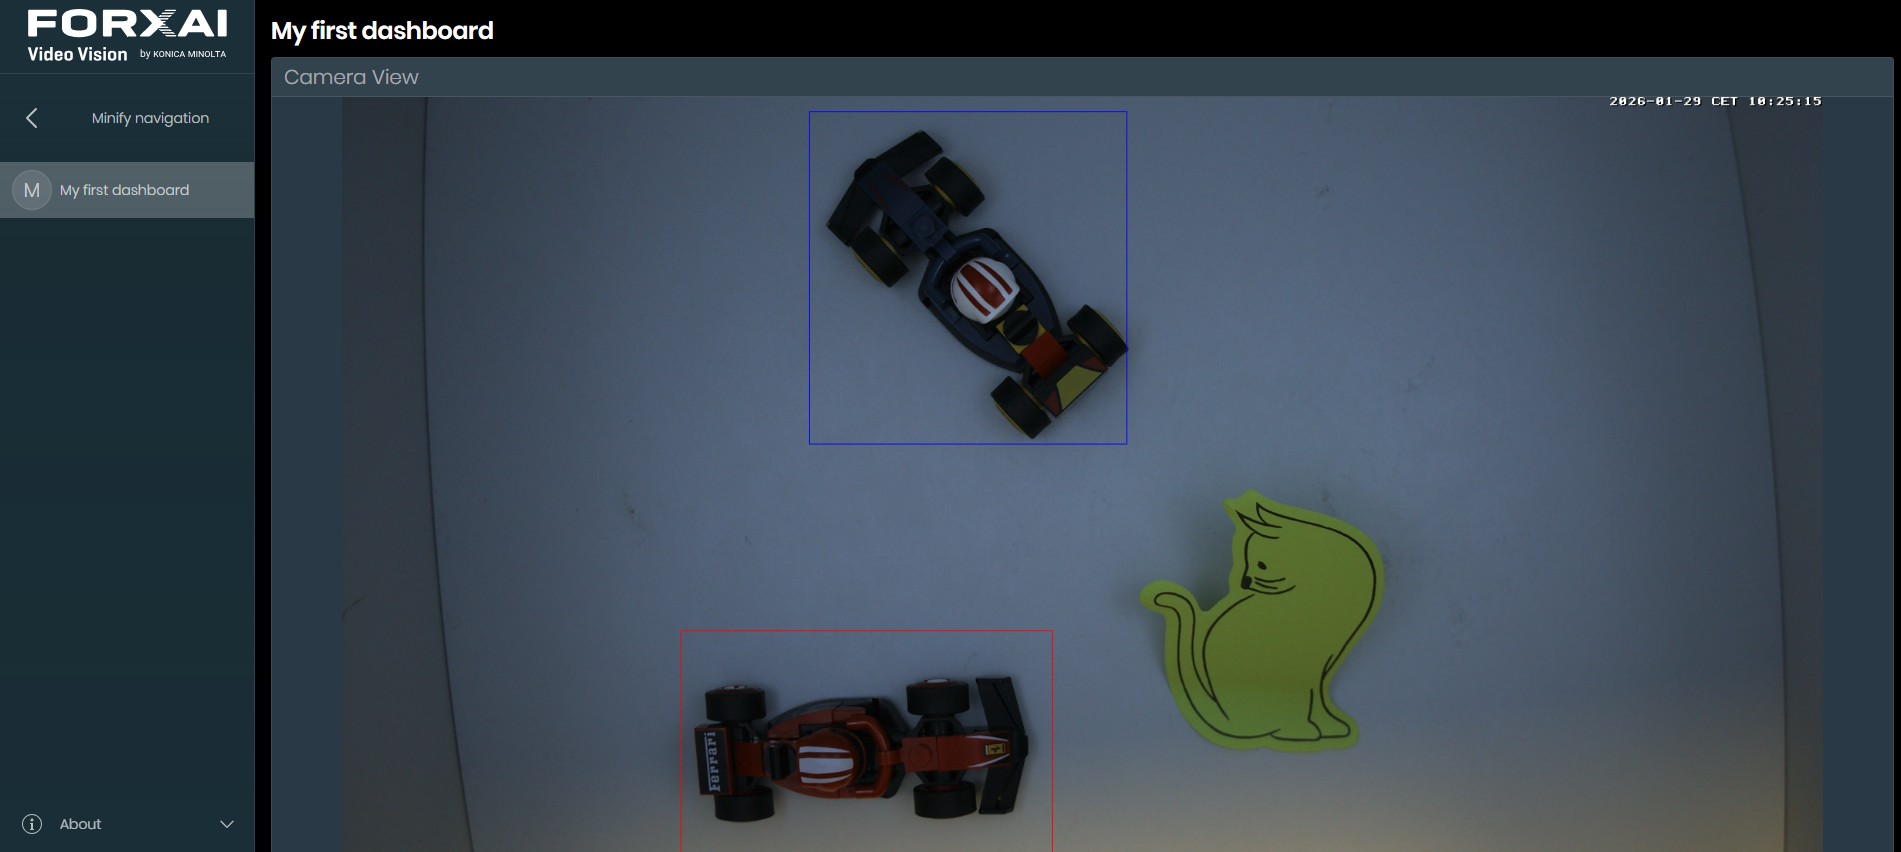
My first dashboard. You will see blue and red polygons around the cars, depending on their color. - Click on the
Camera Viewwidget to zoom it.
Step 8 : Count Frames and Polygons
In this step, you will learn how to use a counter node.
- In the
Builder, stop the running deployment. - Click on
Flow Builder - From the
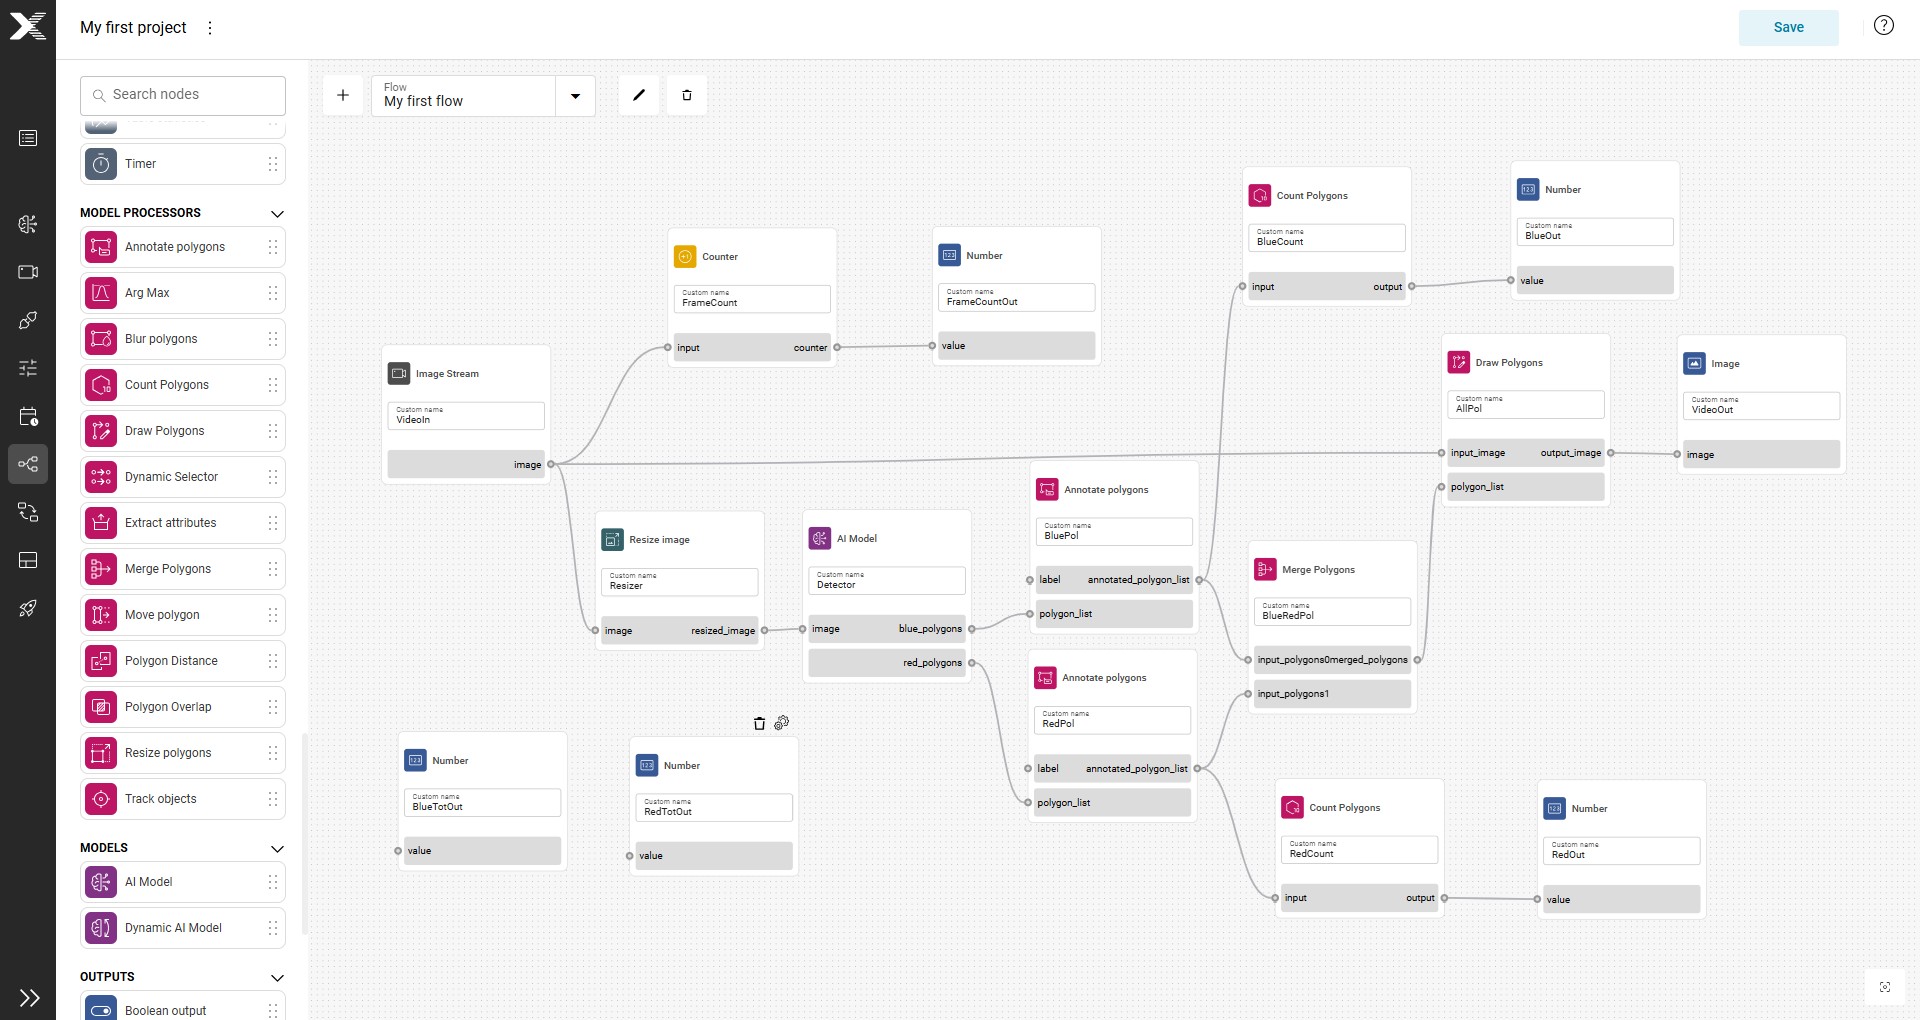
AGGREGATORSgroup, add aCunternode to the flow. Name itFrameCount - Connect the output of
VideoInto the input ofFrameCount - Connect the output of
FrameCountto the input ofFrameCountOut - From the
MODEL PROCESSORSgroup, add twoCount Polygonsnodes to the flow. Name them:BlueCountRedCount
- Connect the output of
BluePolto the input ofBlueCount - Connect the output of
BlueCountto the input ofBlueOut - Connect the output of
RedPolto the input ofRedCount - Connect the output of
RedCountto the input ofRedOut - Click
Saveto store the changes.
- Open the
Deploymenteditor - Click on
Configureto modify the configuration of theFirst Deployment - In the
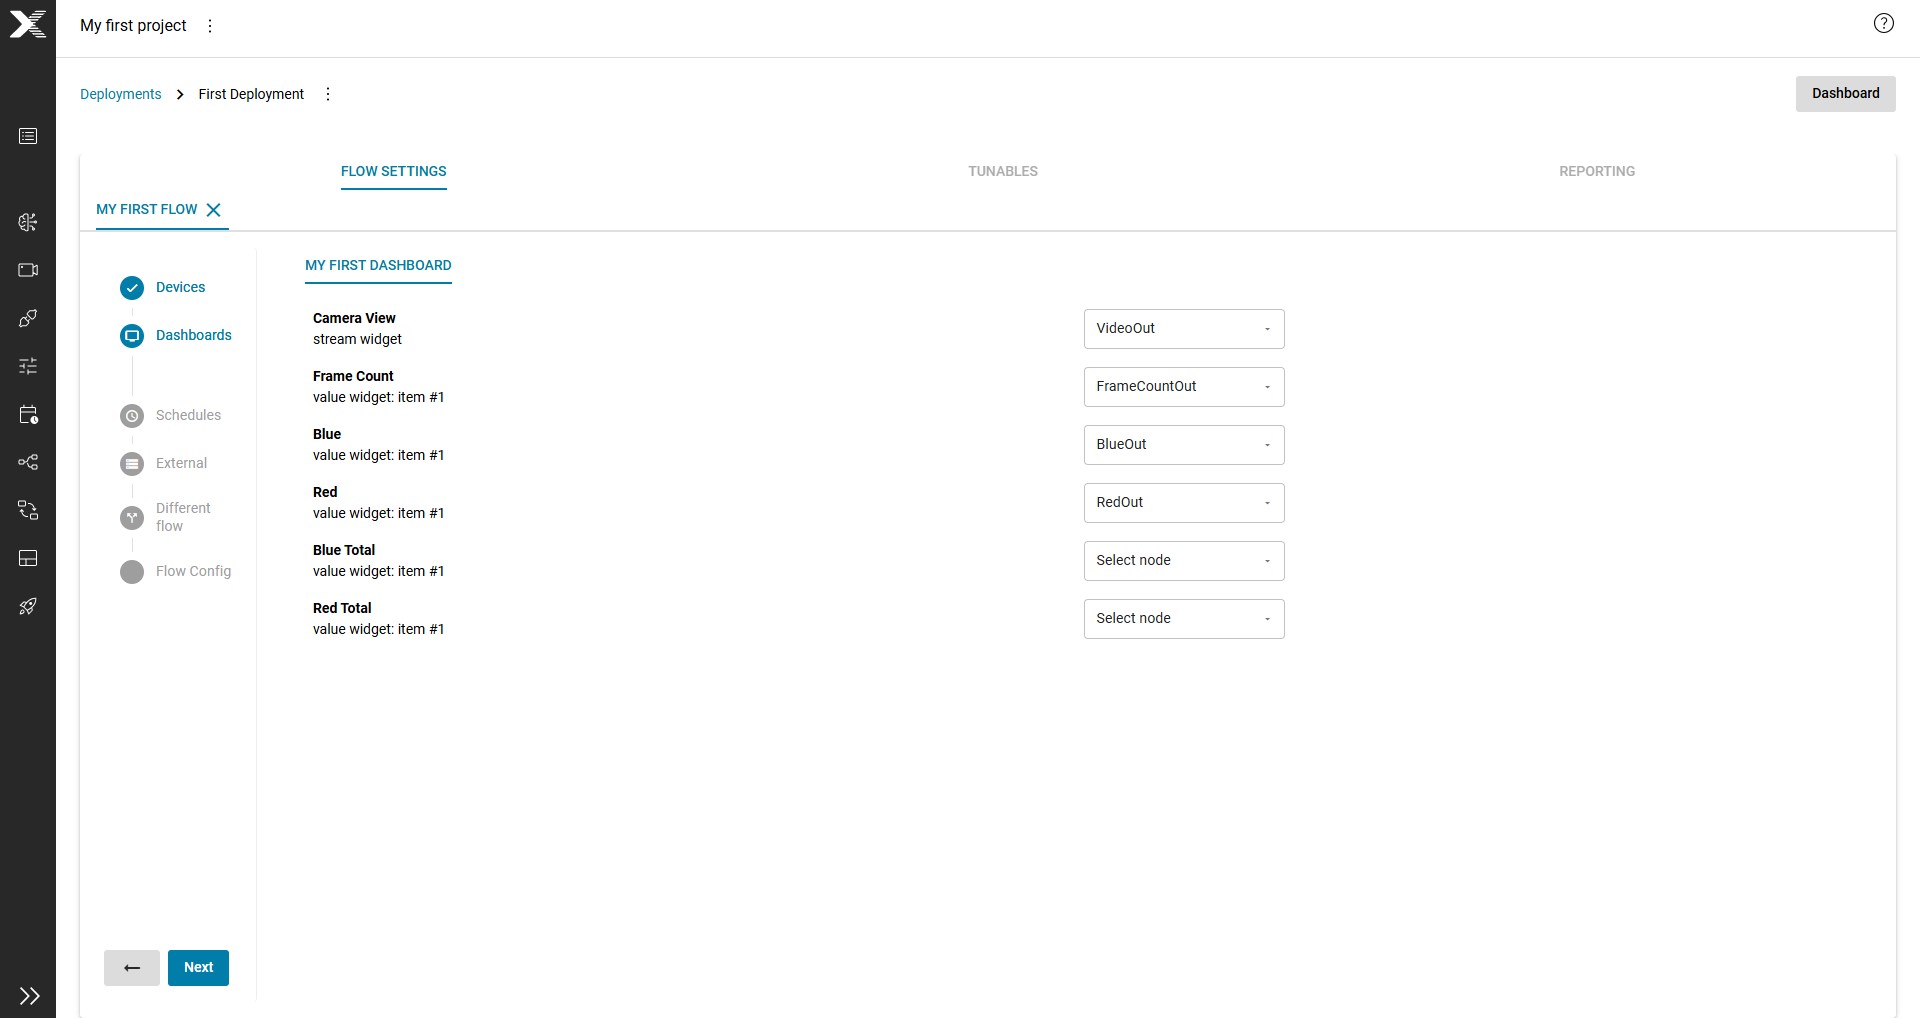
Dashboardpage:- Associate the
FrameCountwidget with theFrameCountOutnode - Associate the
Bluewidget with theBlueOutnode - Associate the
Redwidget with theRedOutnode
- Associate the
- Restart the
First Deployment - In the
Hub, restart theCam01virtual video feed - Reopen the
My first dashboard.
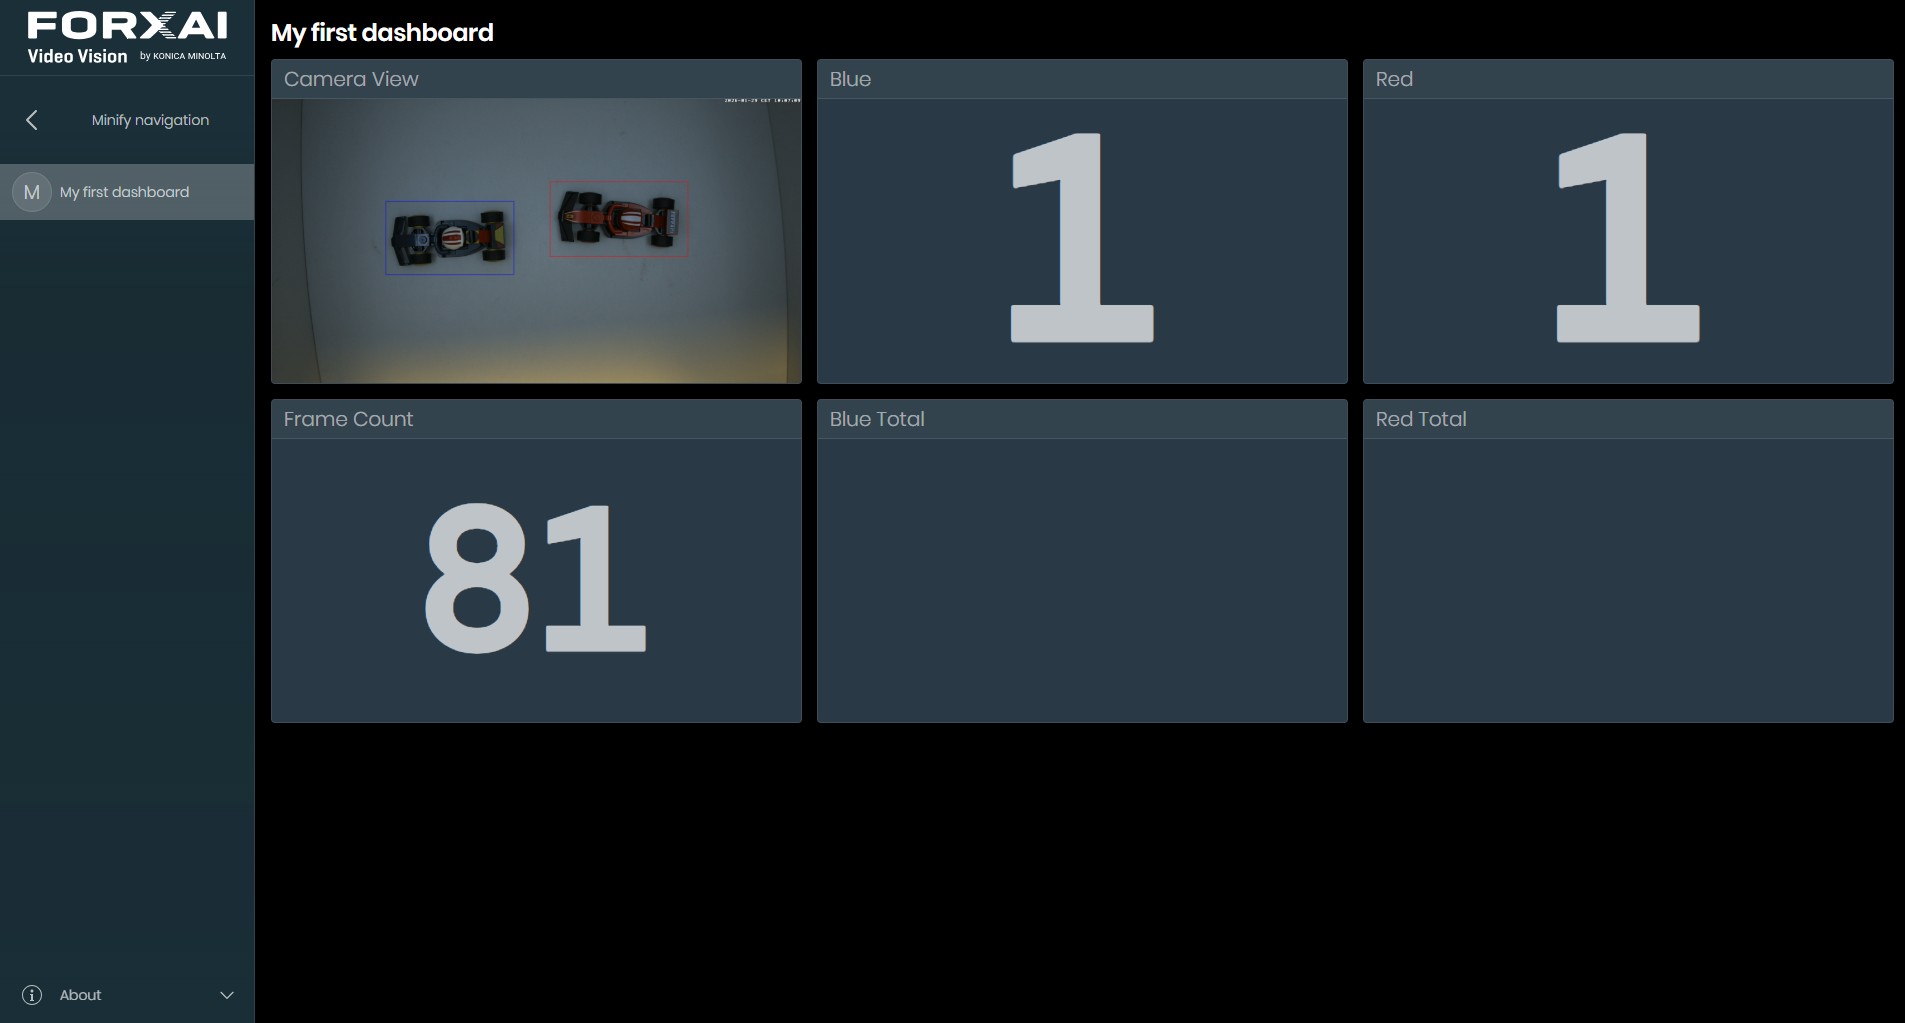
You will now see counters running according to the logic we implemented. The total frame count is displayed in the Frame Count widget. The Blue and Red frame show the number of blue and red cars detected in the current frame.
Step 9 : Accumulate the values
In this step, you will complete the logic by adding the blue and red cars detected in each frame to a counter of total red and blue cars detected since the deployment's start.
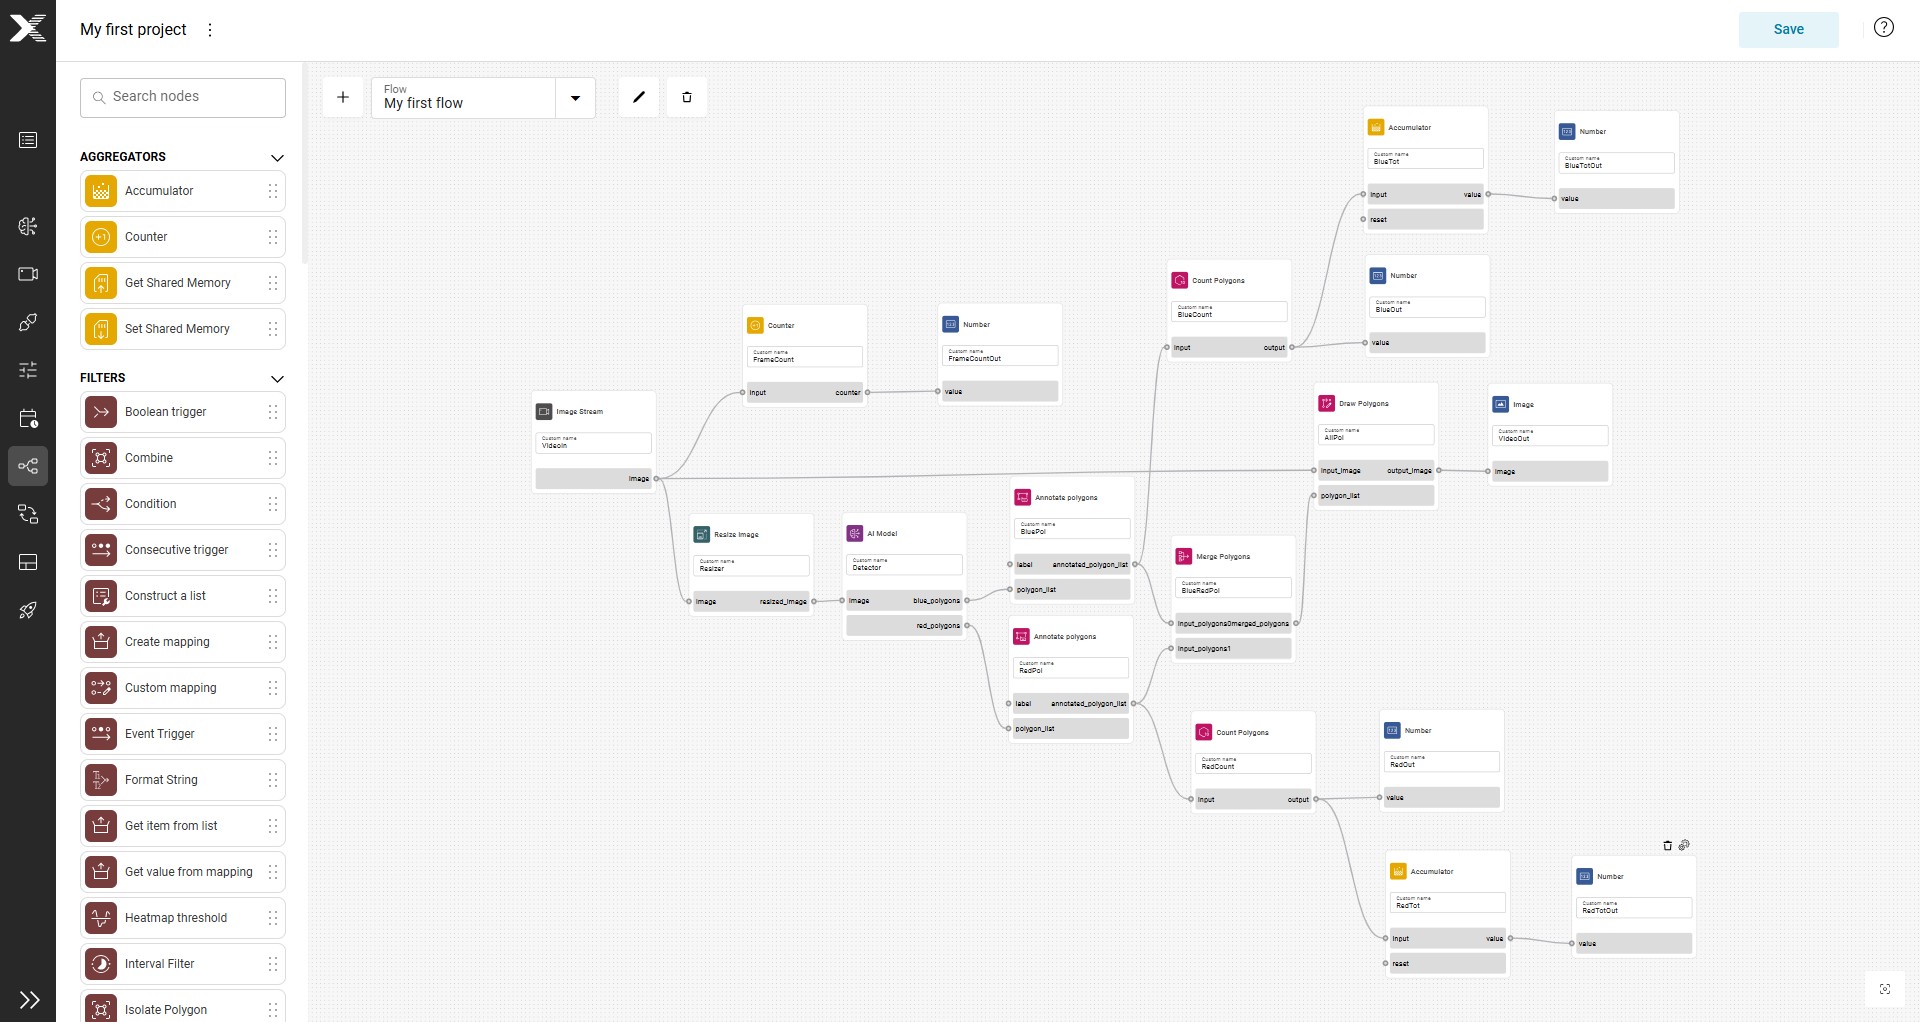
- In the
Builderstop the running deployment - Switch to the
Flow Builder - From the
AGGREGATORSgroup, add twoAccumulatornodes to the flow. Name them:BlueTotRedTot
- Connect the
BlueCountoutput to theBlueTotinputinput - Connect the
BlueTotoutput to the input ofBlueTotOut - Connect the output of
RedCountto the inputinputofRedTot - Connect the output of
RedTotto the input ofRedTotOut - Click
Saveto save the updates
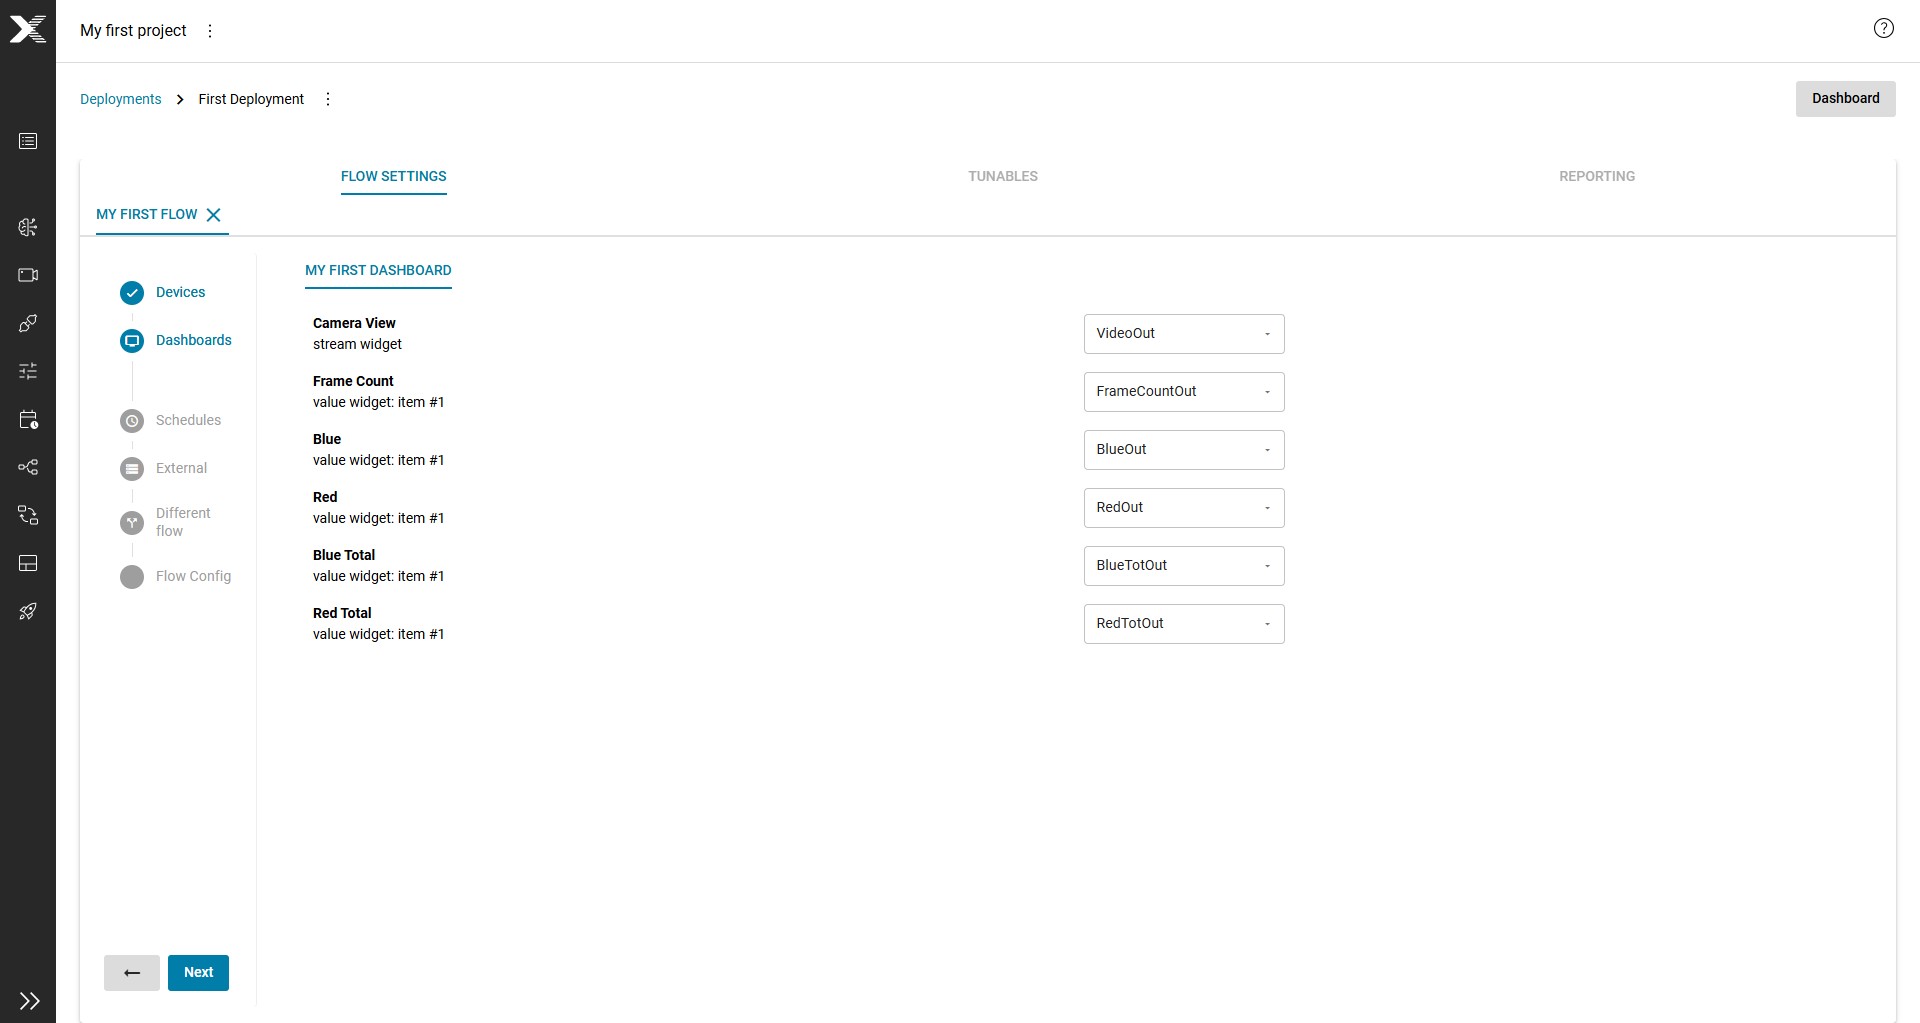
- In the deployment editor, open the configuration of
First Deployment - In the
Dashboardsection, associateBlue Totalwidget withBlueTotOutnodeRed Totalwidget withRedTotOutnode
- Restart the
First Deployment - Restart the
Cam01virtual image feeder - Refresh
My first dashboard
You will now see the total number of red and blue cars accumulate in the Blue Total and Red Total widget.
Verify your work
You've completed the tutorial successfully if:
- Images are streaming in the
Camera Viewwidget - Blue cars in the images are annotated with a blue polygon
- Red cars in the image are annotated with a red polygon
- The counter in the
Frame Countwidget increments by 1 at each image - The counter in the
Bluewidget is equal to the number of blue cars in the image - The counter in the
Redwidget is equal to the number of red cars in the image - The counter in the
Blue Totalwidget is incremented by the number inBluewidget at each frame processed - The counter in the
Red Totalwidget is incremented by the number in theRedwidget at each frame processed.
Summary
In this tutorial, you learned how to:
- Create an image dataset
- Create a project
- Add devices and machine learning models to a project
- Create a flow template and use nodes to create a business logic
- Create a dashboard to visualize the results of the business logic
- Create, start and stop a deployment
- Associate devices with input nodes
- Associate output nodes with dashboard widgets
- Create a virtual camera device and associate it to an image dataset
- Start and stop a virtual camera
You also learned how to switch between the Hub, the Builder and the Dashboards and how to move in them.
Next steps
Now that you've completed this tutorial, you can:
- Explore more the Flow Builder
- Learn more about the available nodes
- Learn more about Video Vision