
Appearance
 Overlay Heatmap
Overlay HeatmapOverview
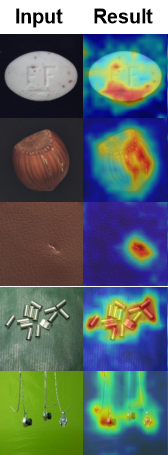
This node blends a color-mapped heatmap onto the input image. It allows users to visualize a heatmap directly within the context of the captured scene.
Use Overlay Heatmap when:
- You need to visualize regions where an AI model detected an anomaly.
💡 Tip
The heatmap input is automatically resized to match the dimensions of the input image before blending.
What is a heatmap?
A heatmap is a data matrix where each pixel is assigned an intensity value. These values can be mapped to a color gradient, highlighting areas of interest such as potential anomalies.
In computer vision, heatmaps help identify defects or irregularities by overlaying these gradients onto an image, making patterns easier to spot.
Inputs
| Name | Type | Description |
|---|---|---|
| image | image | The original background image. |
| heatmap | image | The heatmap data to be overlayed. Single channel image is expected |
Outputs
| Name | Type | Description |
|---|---|---|
| overlayed_heatmap_image | image | The combined image with the blended color-mapped heatmap. |
Parameters
| Parameter | Default | Valid values | Unit | Tunable |
|---|---|---|---|---|
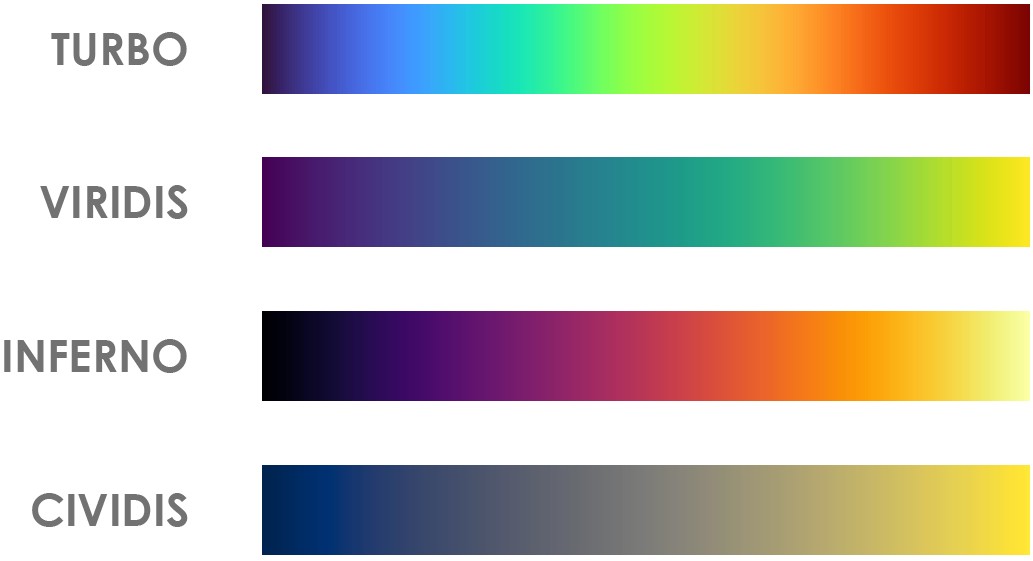
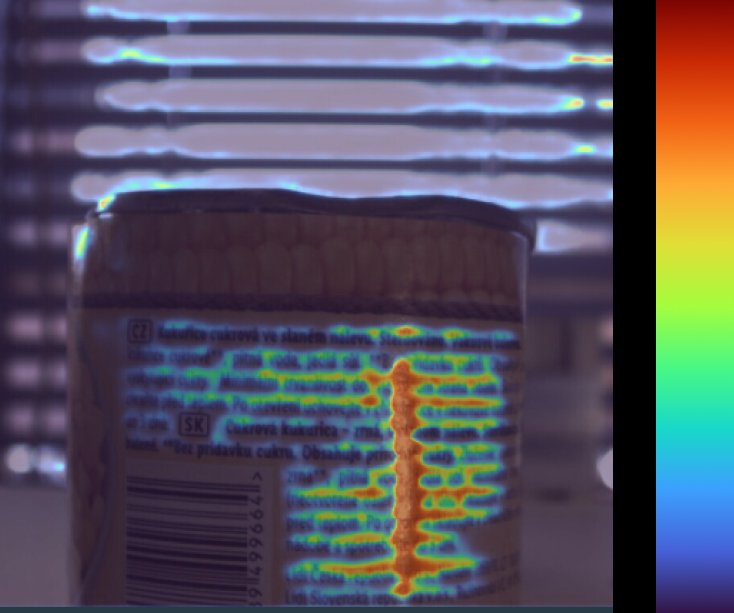
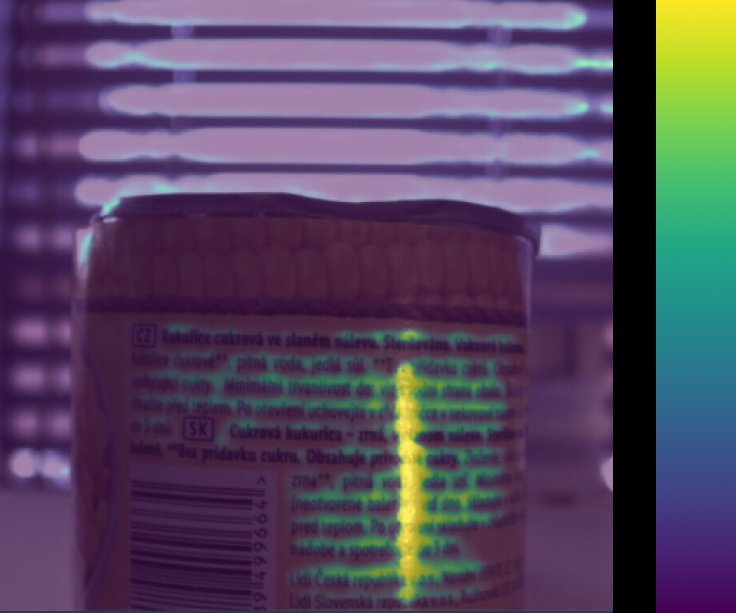
| Heatmap gradient colours | TURBO | TURBO, VIRIDIS, INFERNO, CIVIDIS | - | ❌ |
| Heatmap opacity | 50 | 0 – 100 | % | ✅ |
| Display zero values | false | true / false | - | ✅ |
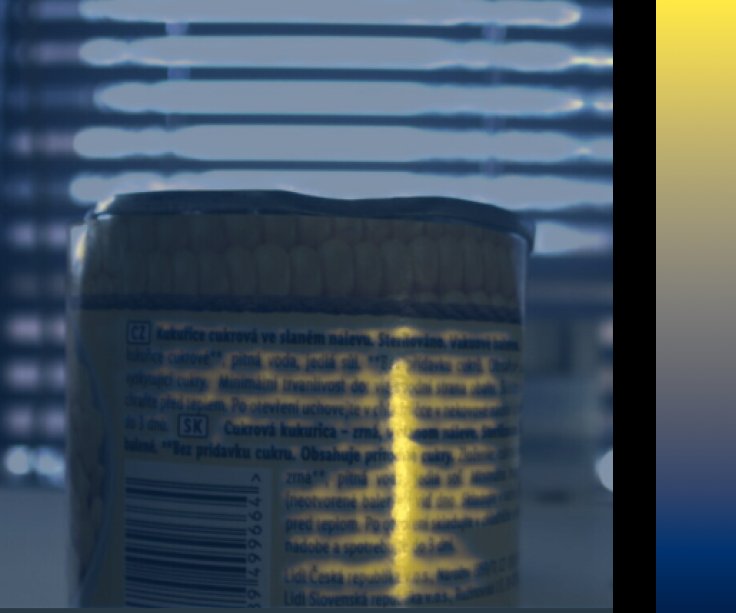
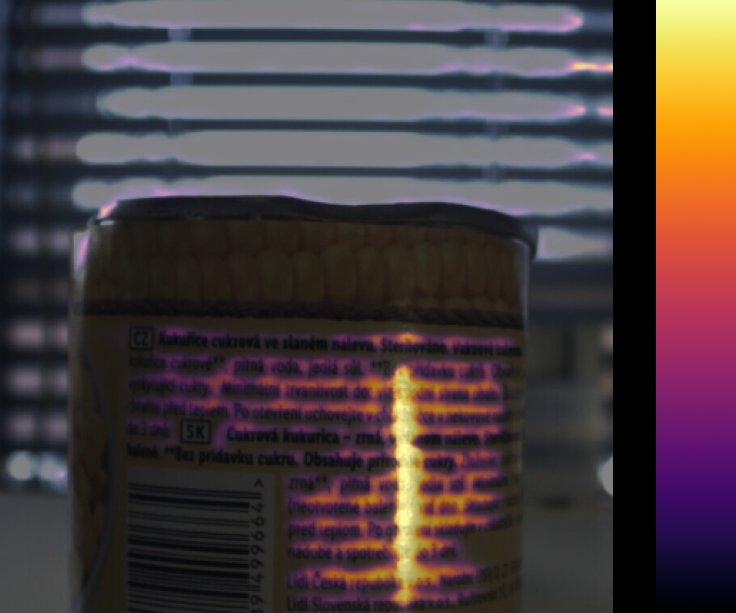
Heatmap gradient colours
The color palette used to map the heatmap intensity values to a specific color. Options like VIRIDIS and CIVIDIS are designed to be perceptually uniform and colorblind-friendly.
Heatmap opacity
Controls the transparency of the heatmap overlay. A value of 0 makes the heatmap invisible, while 100 makes it fully opaque, hiding the original image.
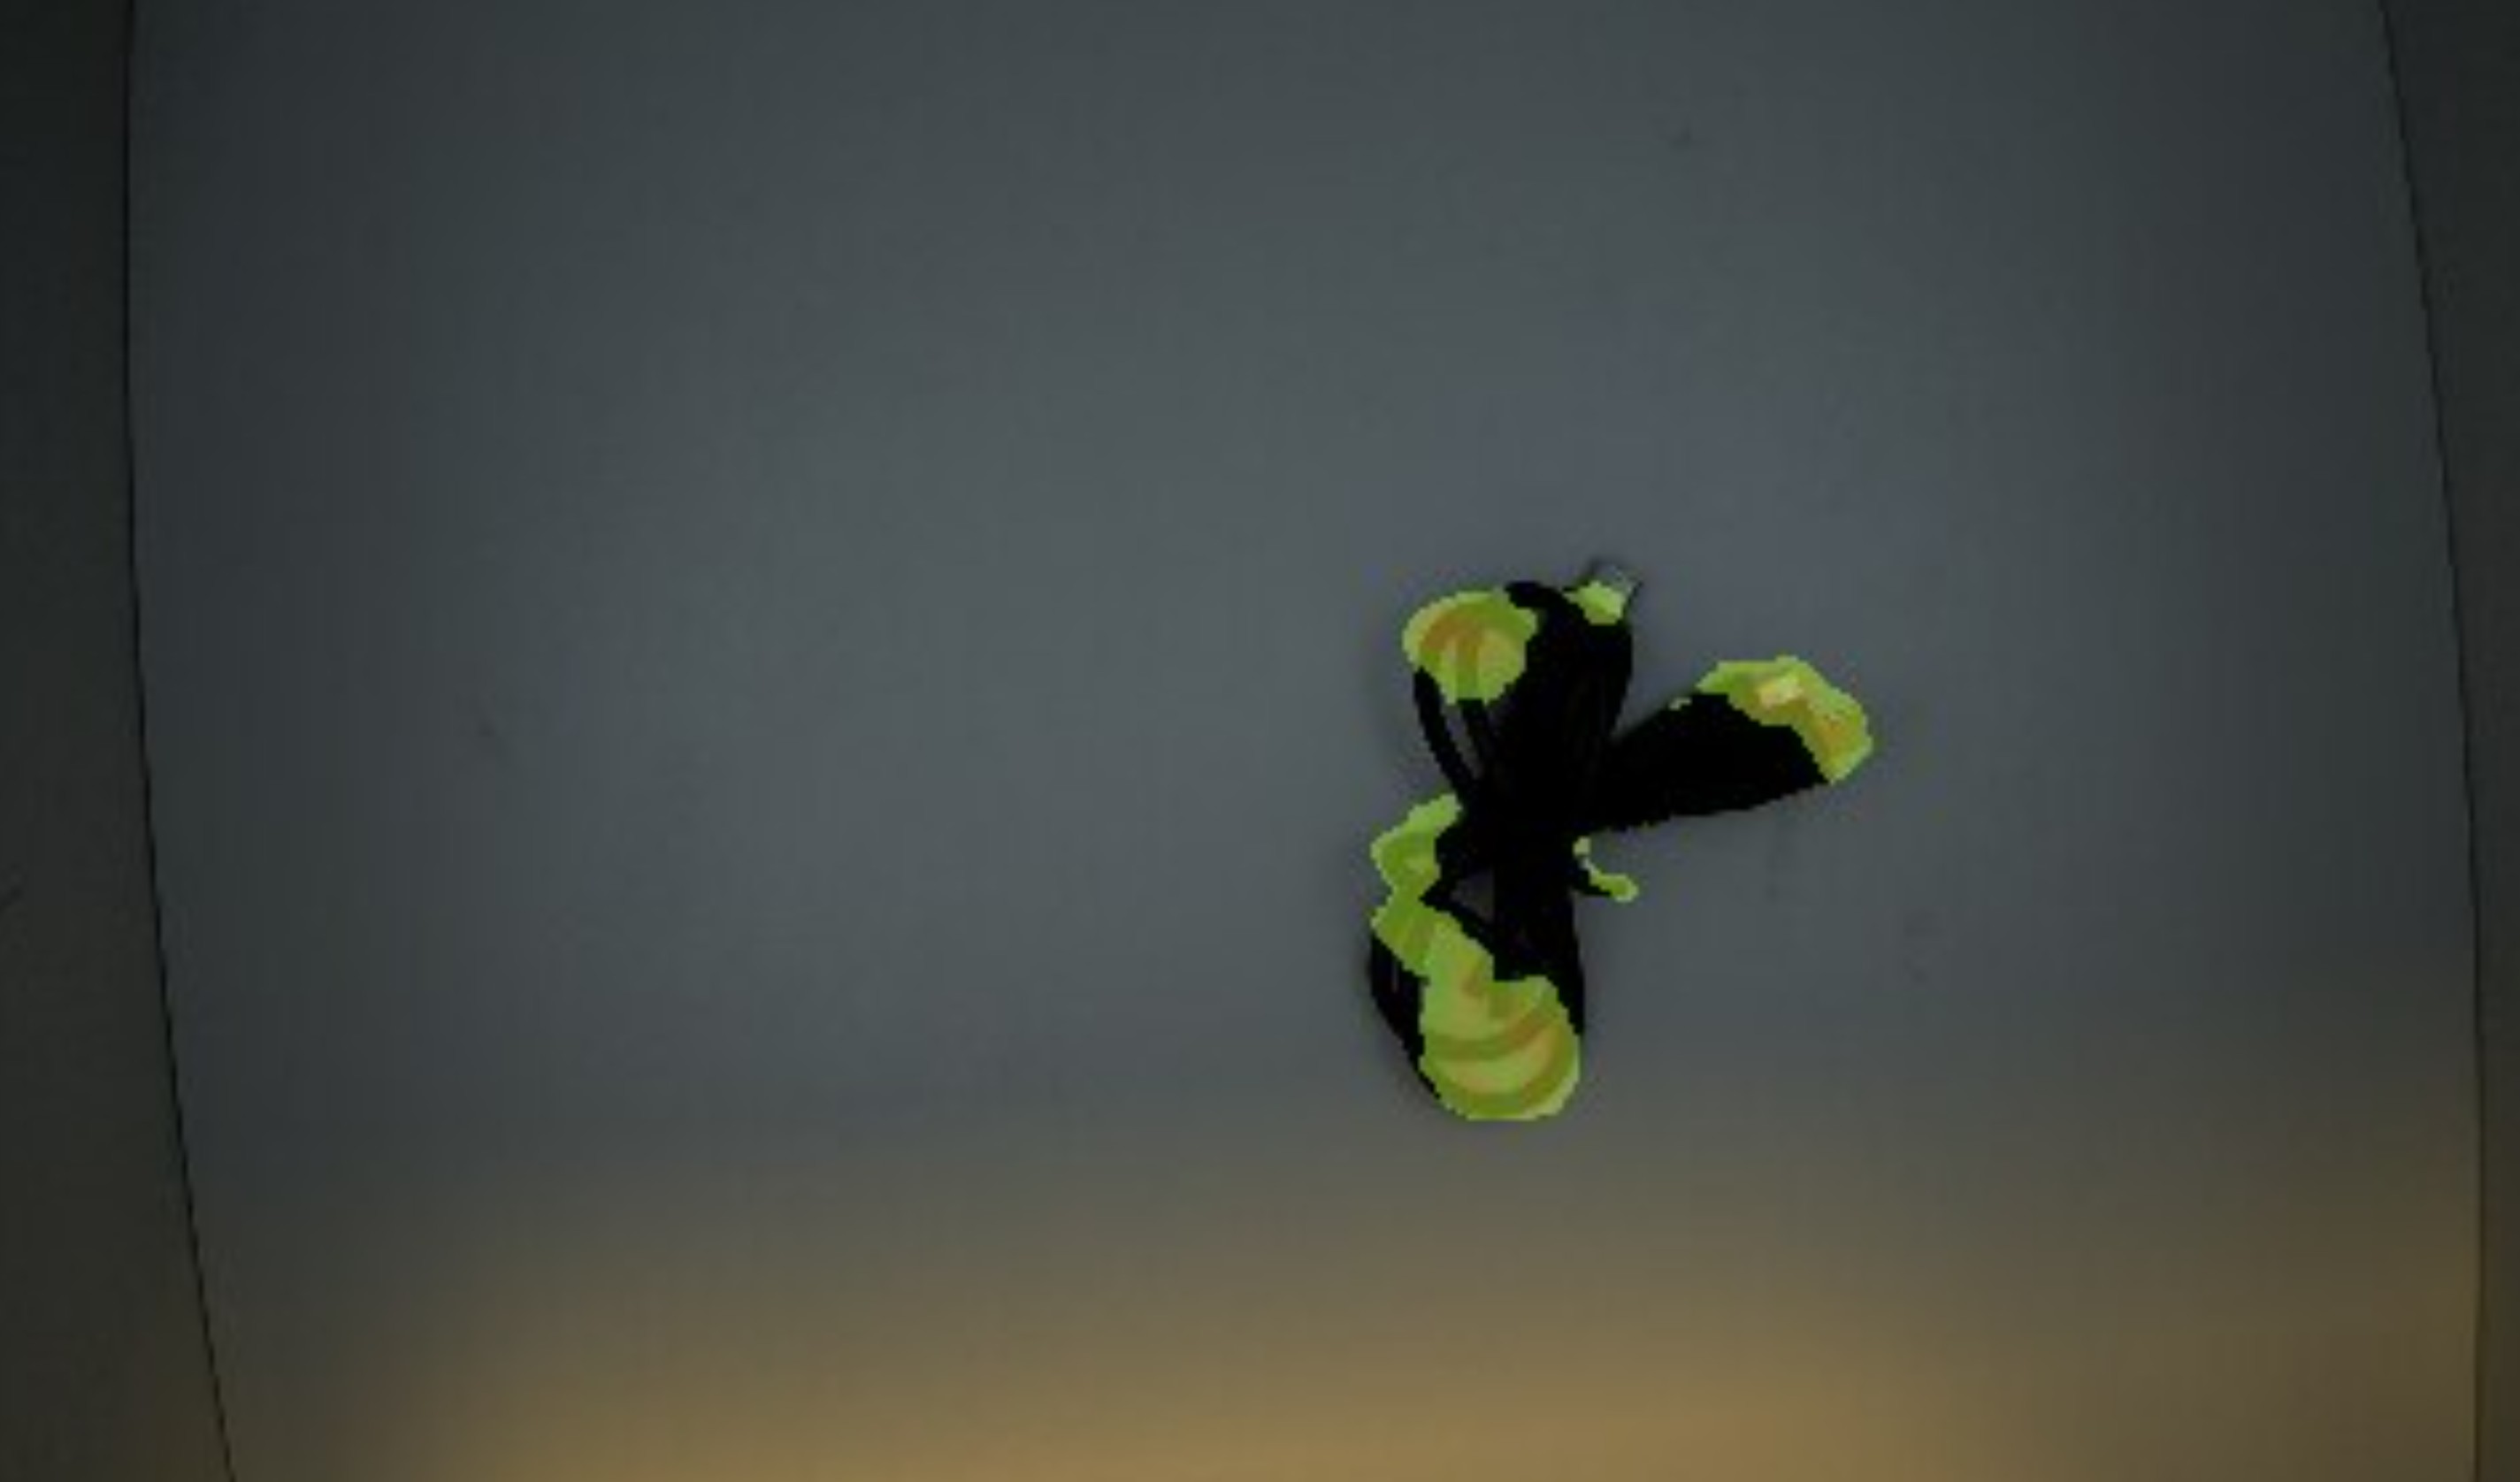
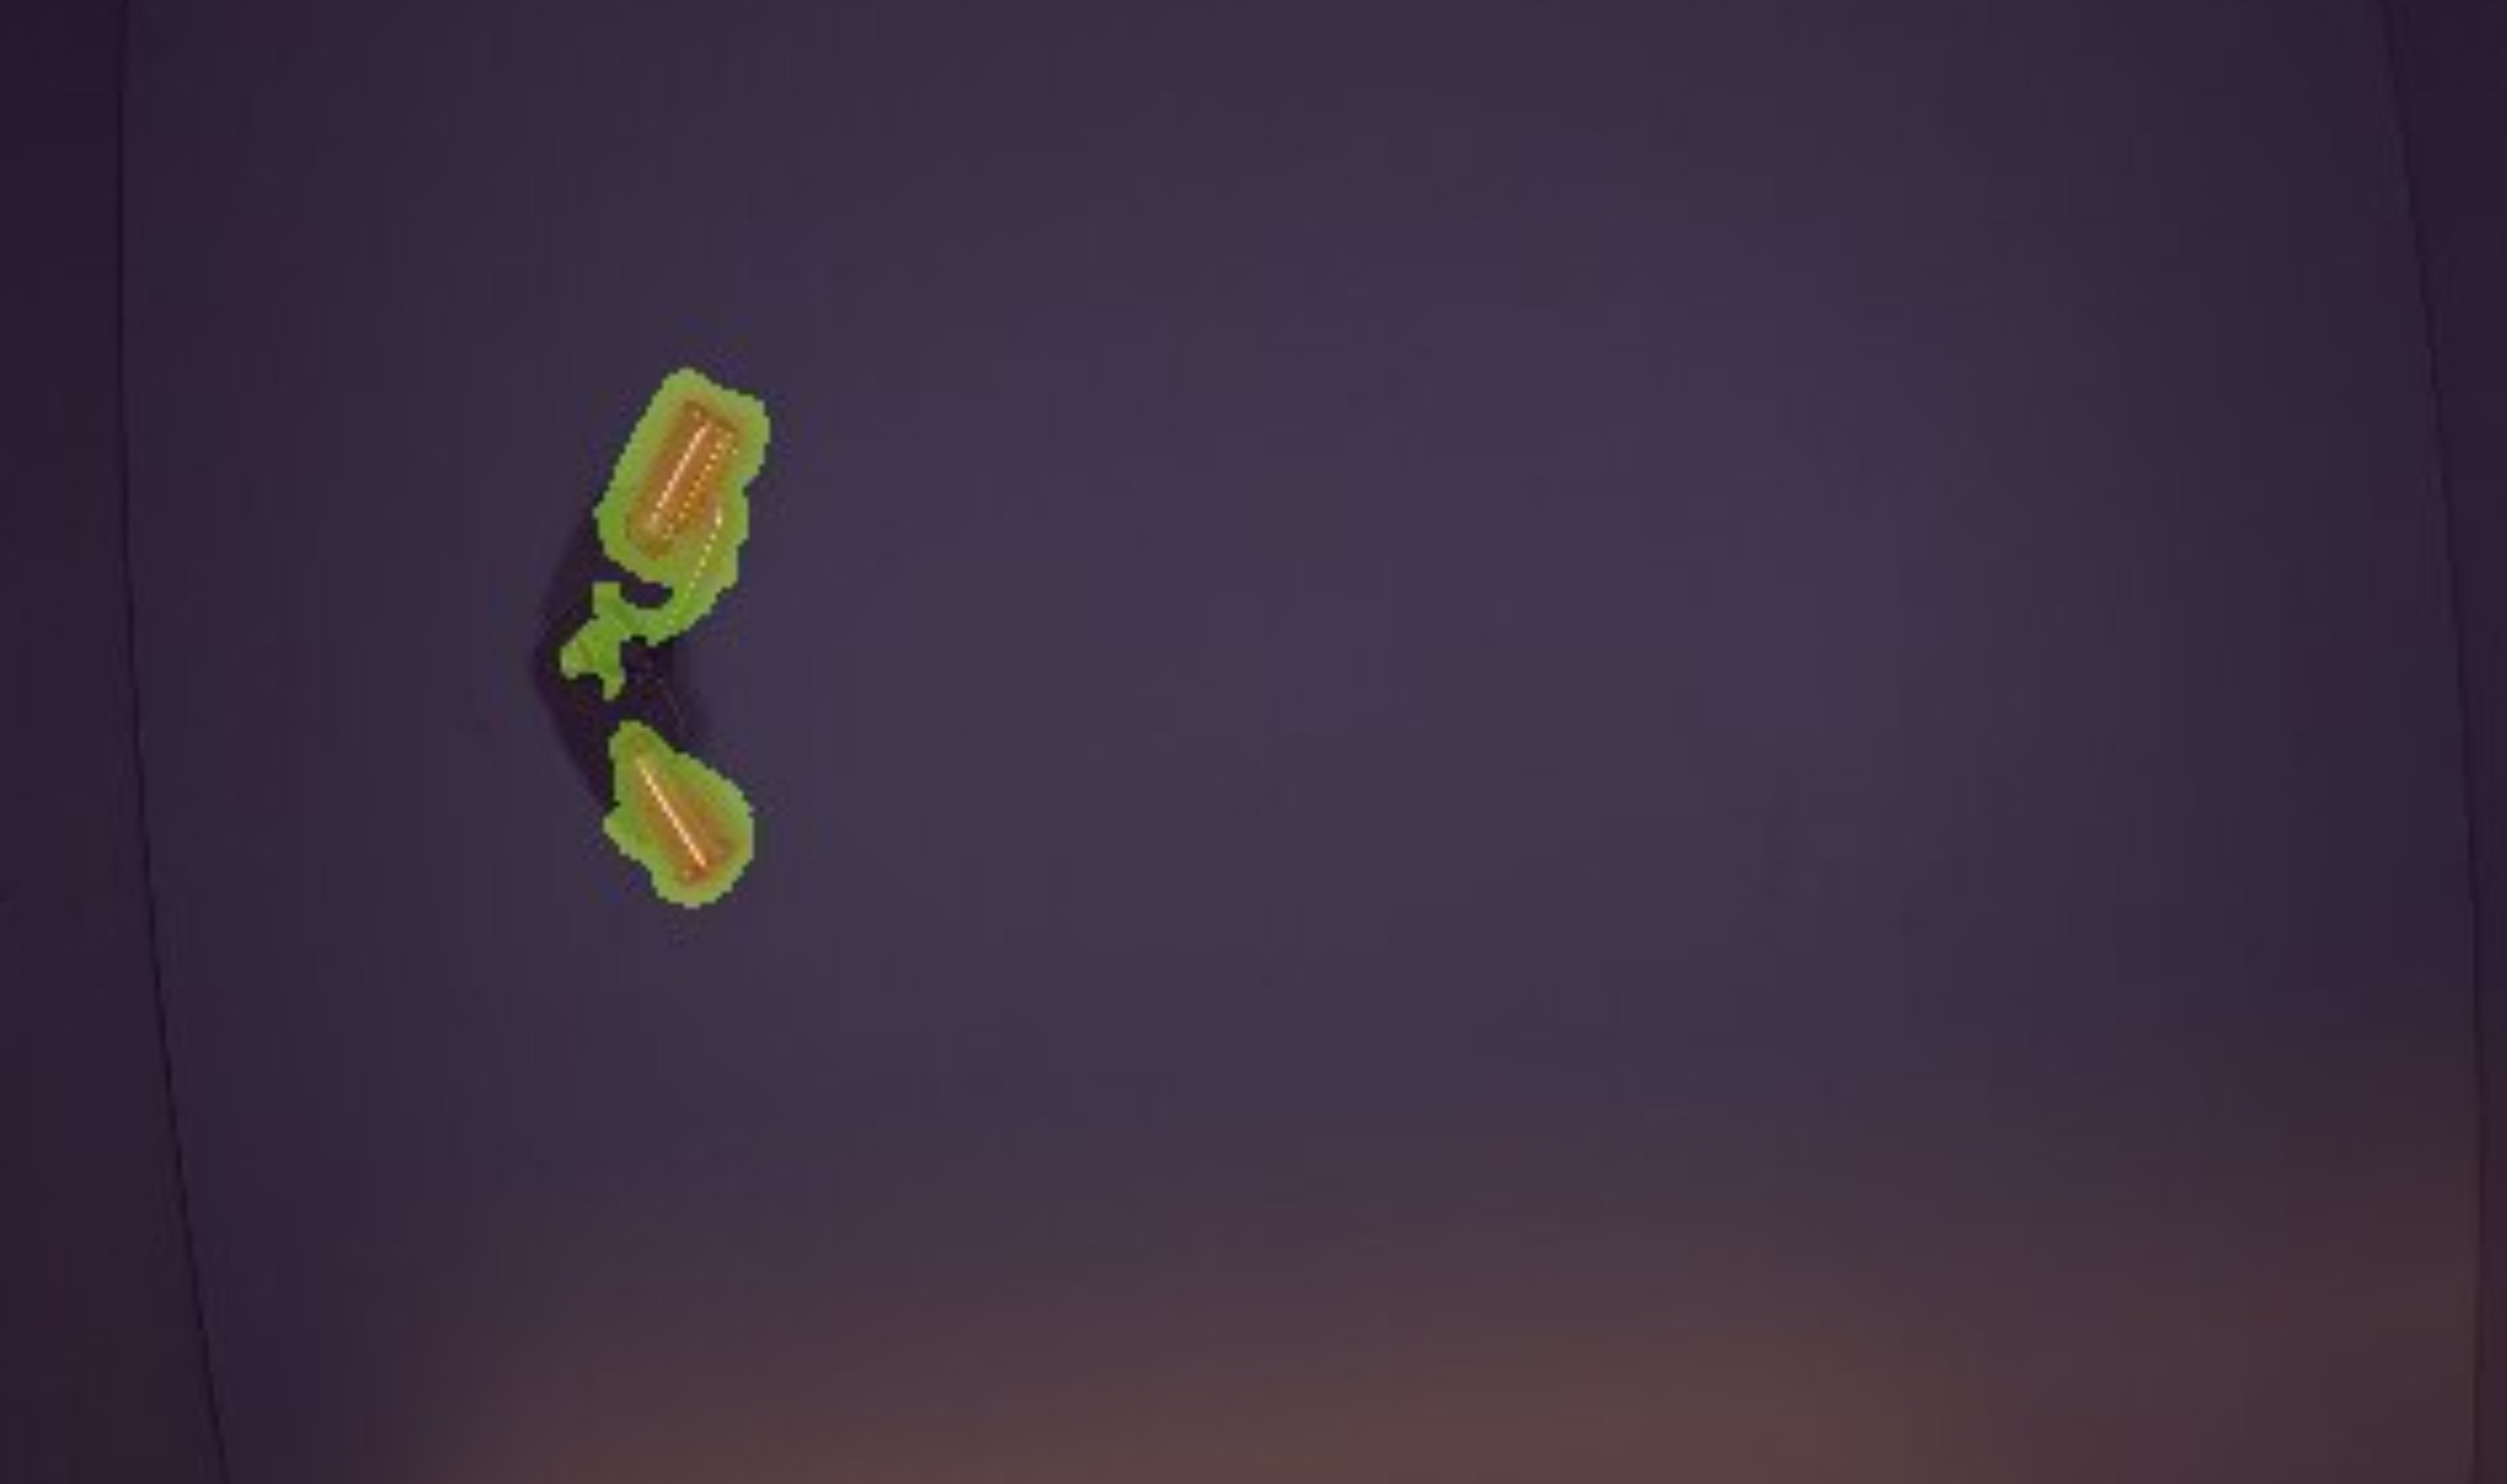
Display zero values
Controls whether regions with a heatmap value of 0 receive the color overlay.
- false (default): Pixels where the heatmap value is
0show the original image unchanged — the overlay is applied only where the heatmap has non-zero intensity. - true: The entire image is overlayed by the colormap, including areas with no heatmap signal.
Example
Visualize anomaly detection
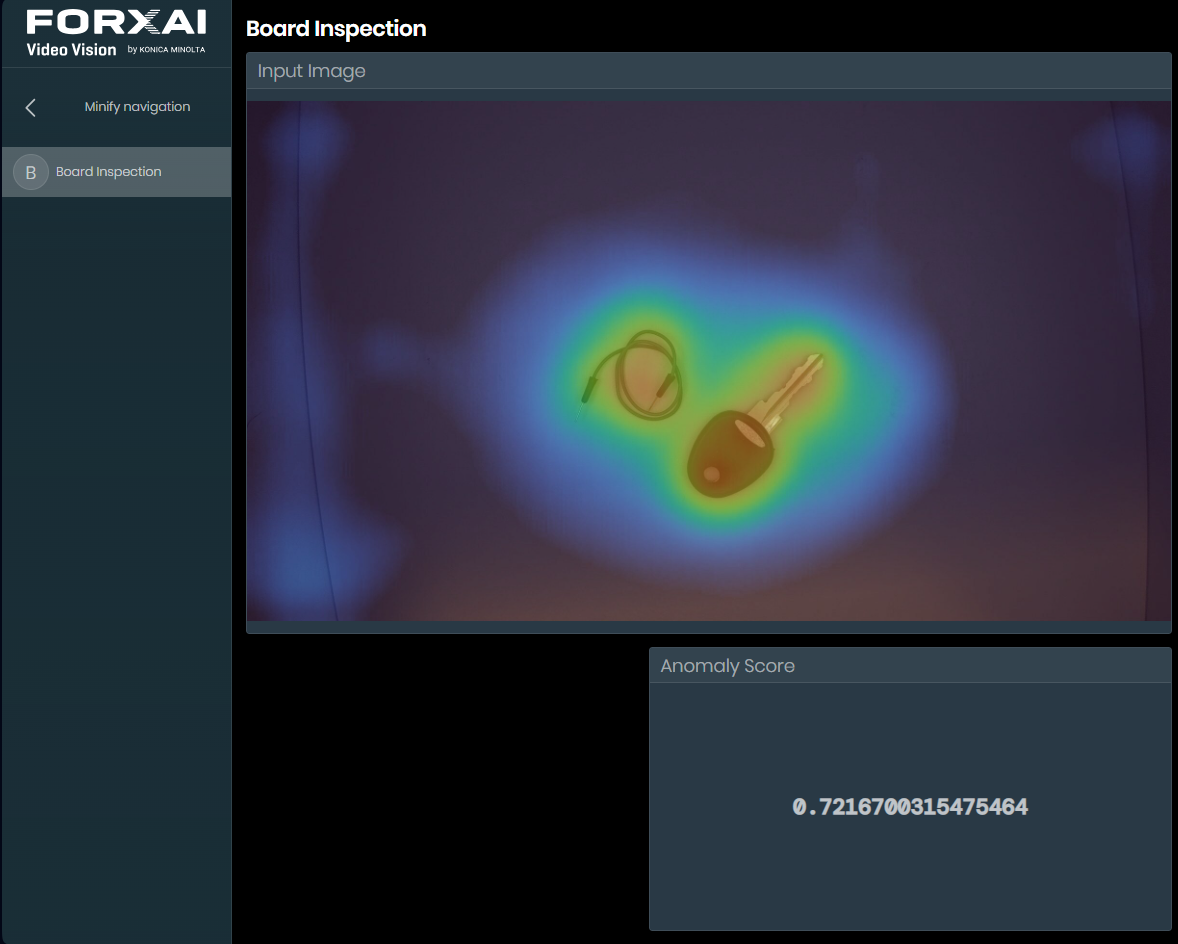
An AI model generates an anomaly heatmap of potential foreign defects. This node applies the "TURBO" colormap at 50% opacity to highlight these defects in bright yellow/orange.
Configuration:
- Heatmap gradient colours:
TURBO - Heatmap opacity:
50
Result:
Related links
Reference:
- Heatmap Threshold — thresholds a heatmap, removing low-intensity pixels
- AI Model — generating heatmaps from visual data