
Appearance
Reporting
Reporting enables users to review and analyze detection results, including defects, discrepancies, and inspection outcomes, in a detailed, organized format. It also allows for generating downloadable reports in CSV format, complete with associated images for analysis and record-keeping.
Prepare Reporting in the Flow Builder
In this section, you will configure the flow to capture and output data for reporting.
Follow these steps:
Select Flow Builder in the left panel.
Configure the flow as you normally would to process images and generate detection outputs. Refer to the Flow Builder guide for detailed specifications.
⚠️ Reporting only supports the following Output value types:
String
Number
Boolean
Image
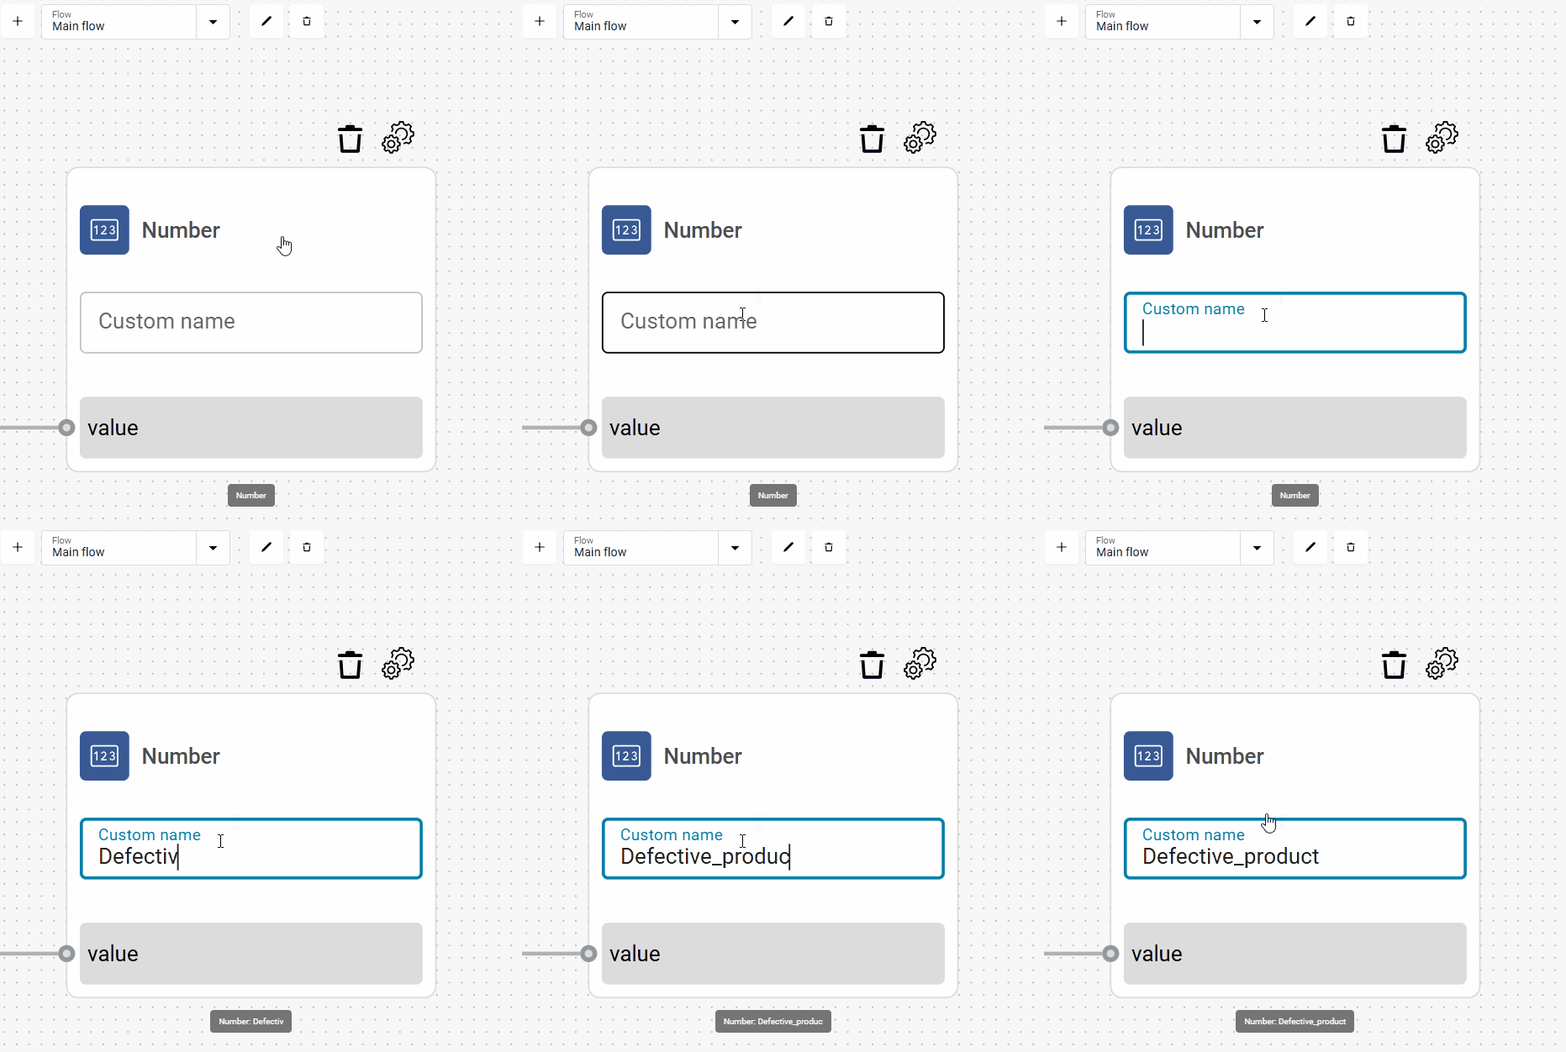
Make sure to label all Output nodes to easily identify them later.
- Click Save to confirm any changes.
Capture Flow node
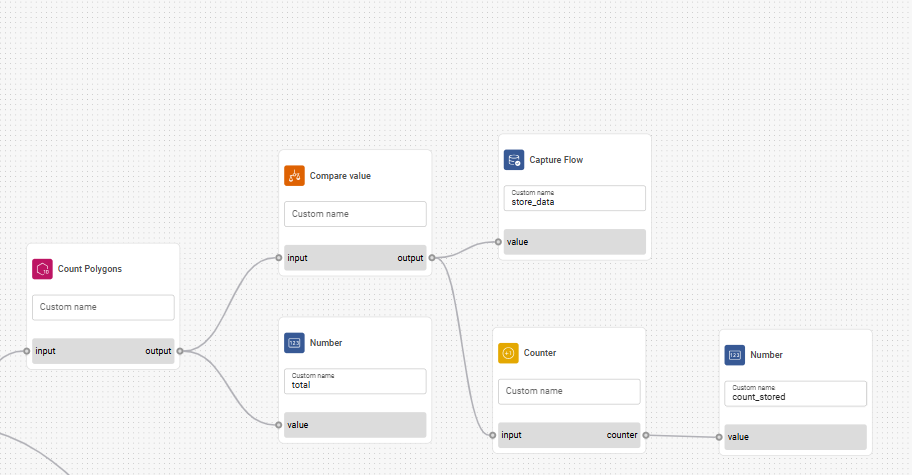
To capture flow outputs under specific conditions, use the Capture Flow node.
When this node receives a true boolean signal, it records data from all Output nodes in the flow, provided those nodes are marked for reporting in the Deployment settings. If the received signal is false or absent, none of the selected outputs are stored.
For example, you can collect flow data only when specific conditions are met, such as detecting a defect or exceeding a certain value threshold.
💡 Tip
The Capture Flow node only captures outputs that are selected in the Deployment configuration.
Set Up Reporting
This section describes how to set up Reporting, which outputs are to be included in the reports, and how to set the retention period for the data.
Note
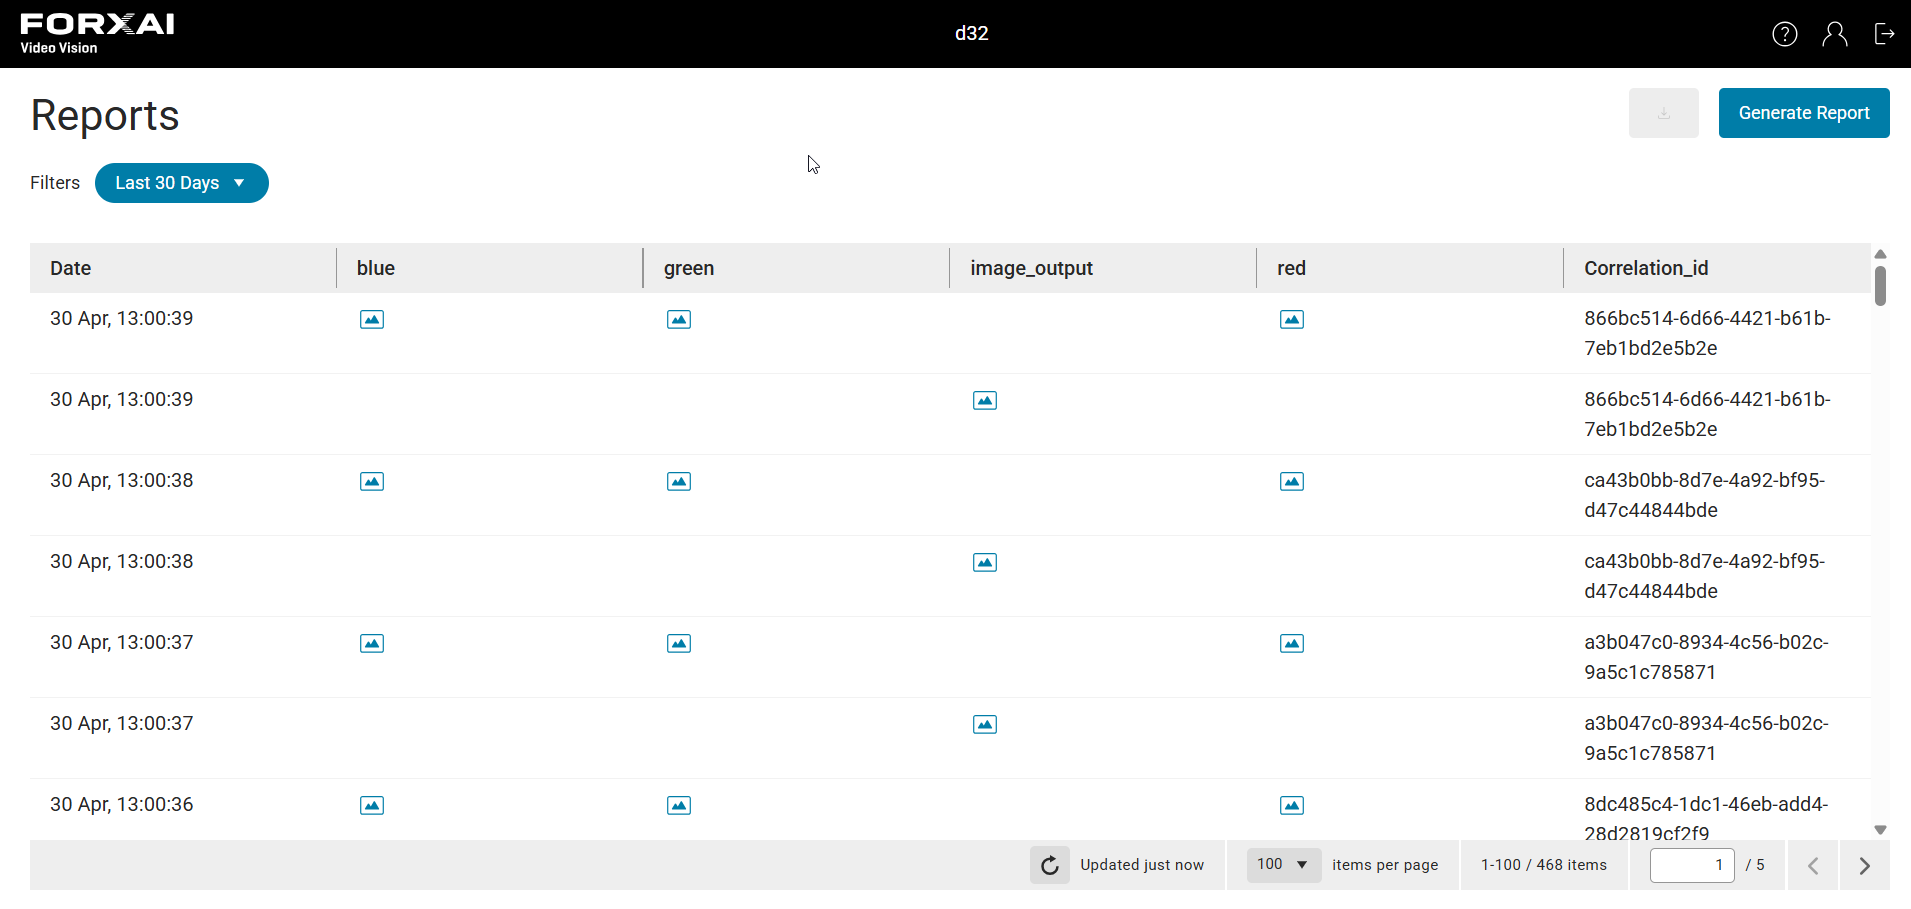
You can select multiple images or other output types from flows. Selecting outputs from different flows, will result in statistics grouped in different rows of reporting dashboard. Each row will contain results from single flow even though they are part of same detection (as indicated by correlation_id column). See an example of reporting overview.
⚠️ Warning
Reporting can only be configured after you already have a flow set up with relevant output nodes.
Follow these steps:
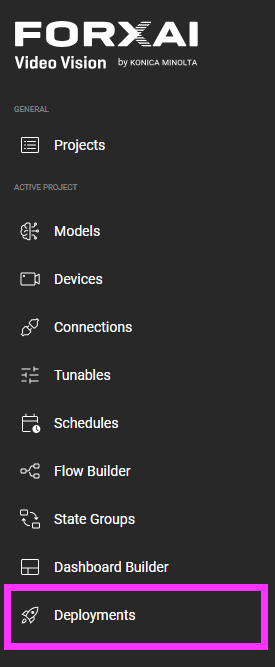
- Select Deployments in the left panel.
Click Create Deployment.
Click the Enable reporting checkbox.
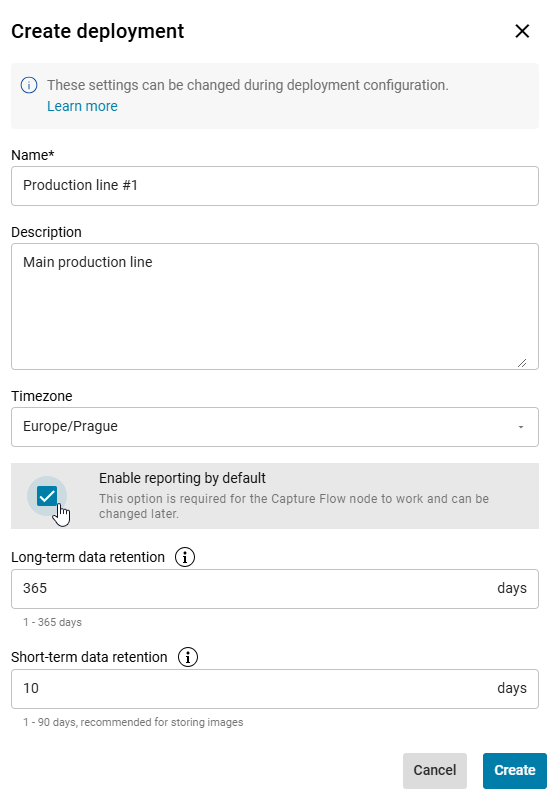
- (Optional) Set the short-term and long-term data retention period.
💡 Tip
Use long-term retention for compact data, such as text or numbers. Reserve short-term retention for image files, which take up significantly more space.
You will assign short-term and long-term storage to specific items during Deployment configuration.
❌ Once the retention period ends, data is permanently deleted and cannot be recovered.
Continue with the Deployment setup.
Click the Reporting tab in Deployments.
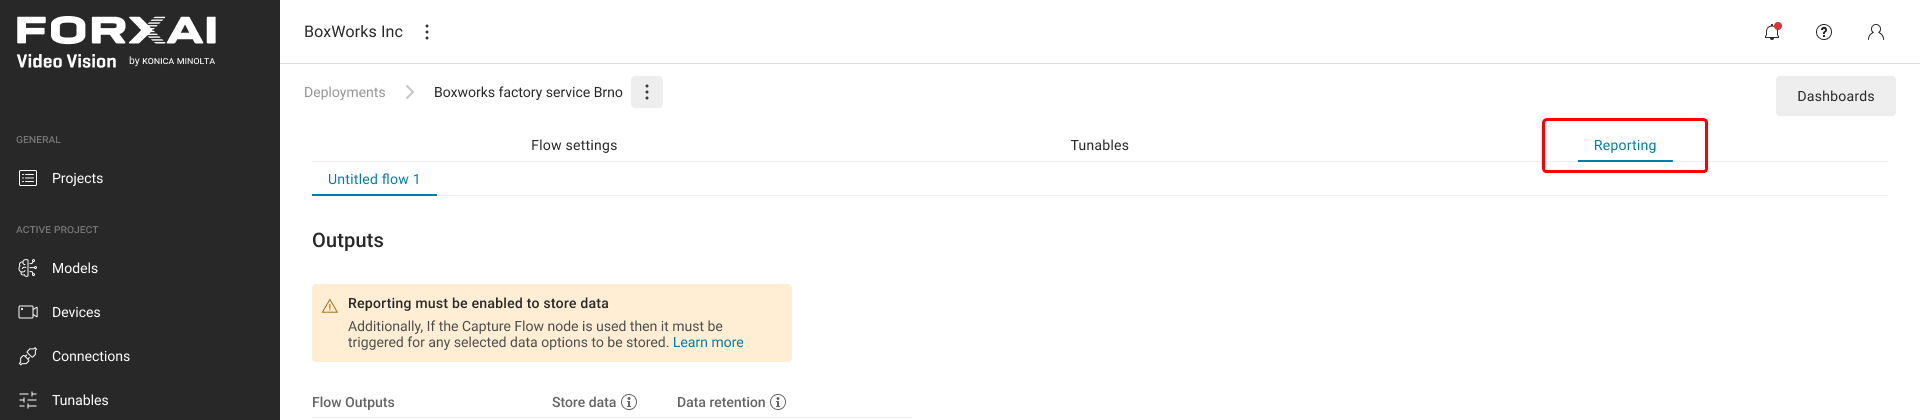
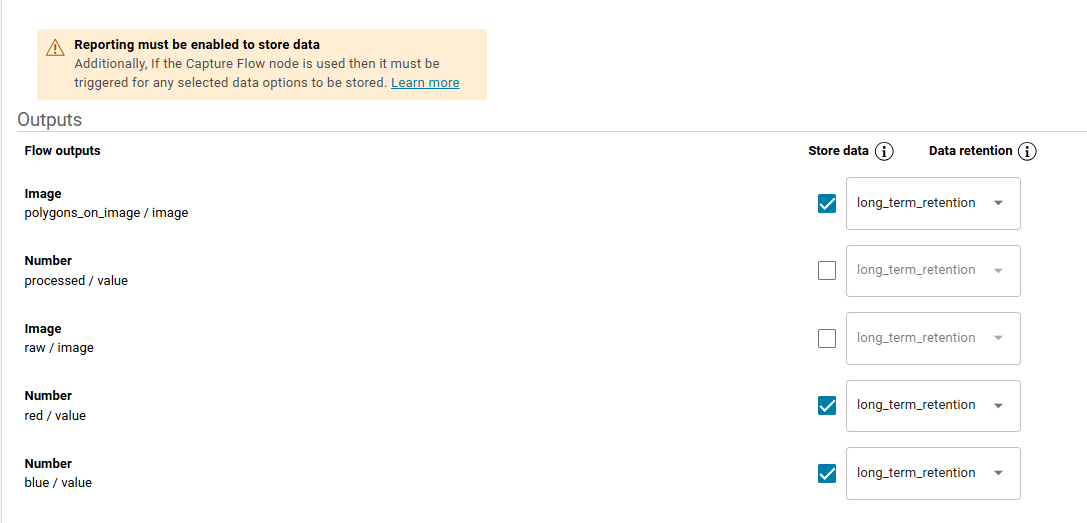
Select which outputs you want to store by clicking the checkbox in the Store data column.
Set which outputs are to be saved for long-term or short-term retention period.
⚠️ Warning
It's possible to run upload to the different servers at the same time, but it's not possible run the same export on the same external storage (to the same remote path), only in case you're clicking rewrite option, it'll restart uploading process.
Click Done to confirm your changes.
Access Reports
Once reporting is enabled and data is collected, you can access the Reports section to review detections and generate downloadable reports.
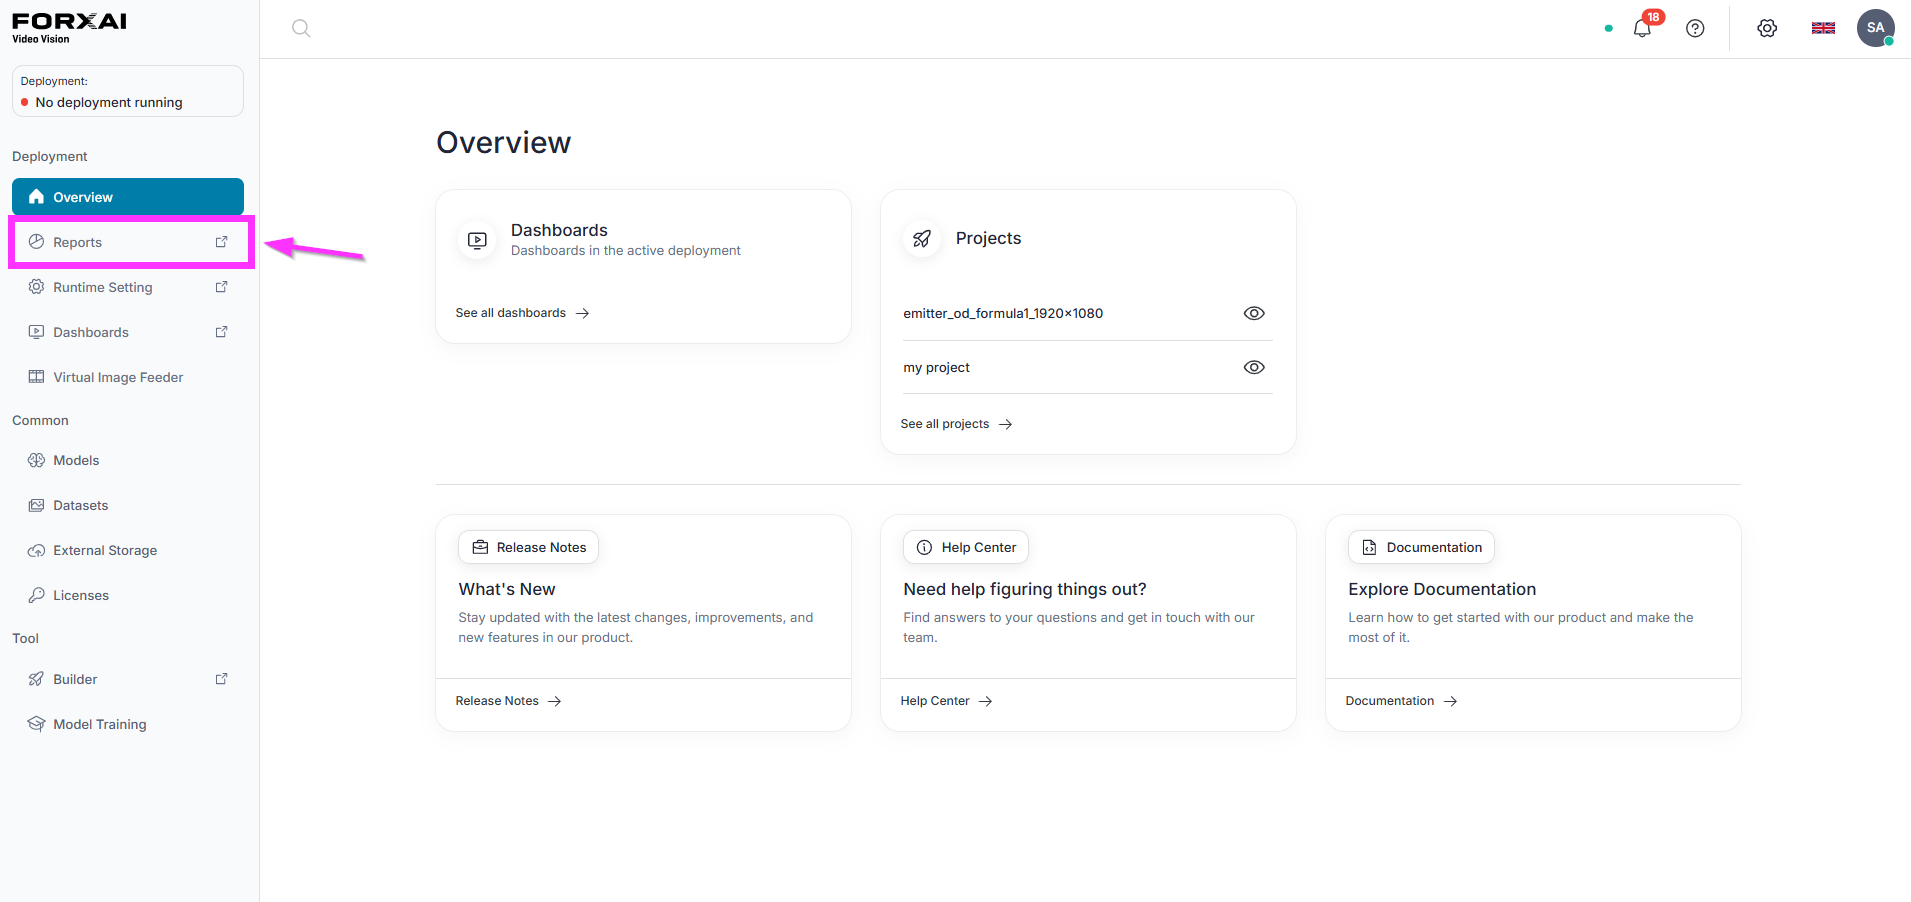
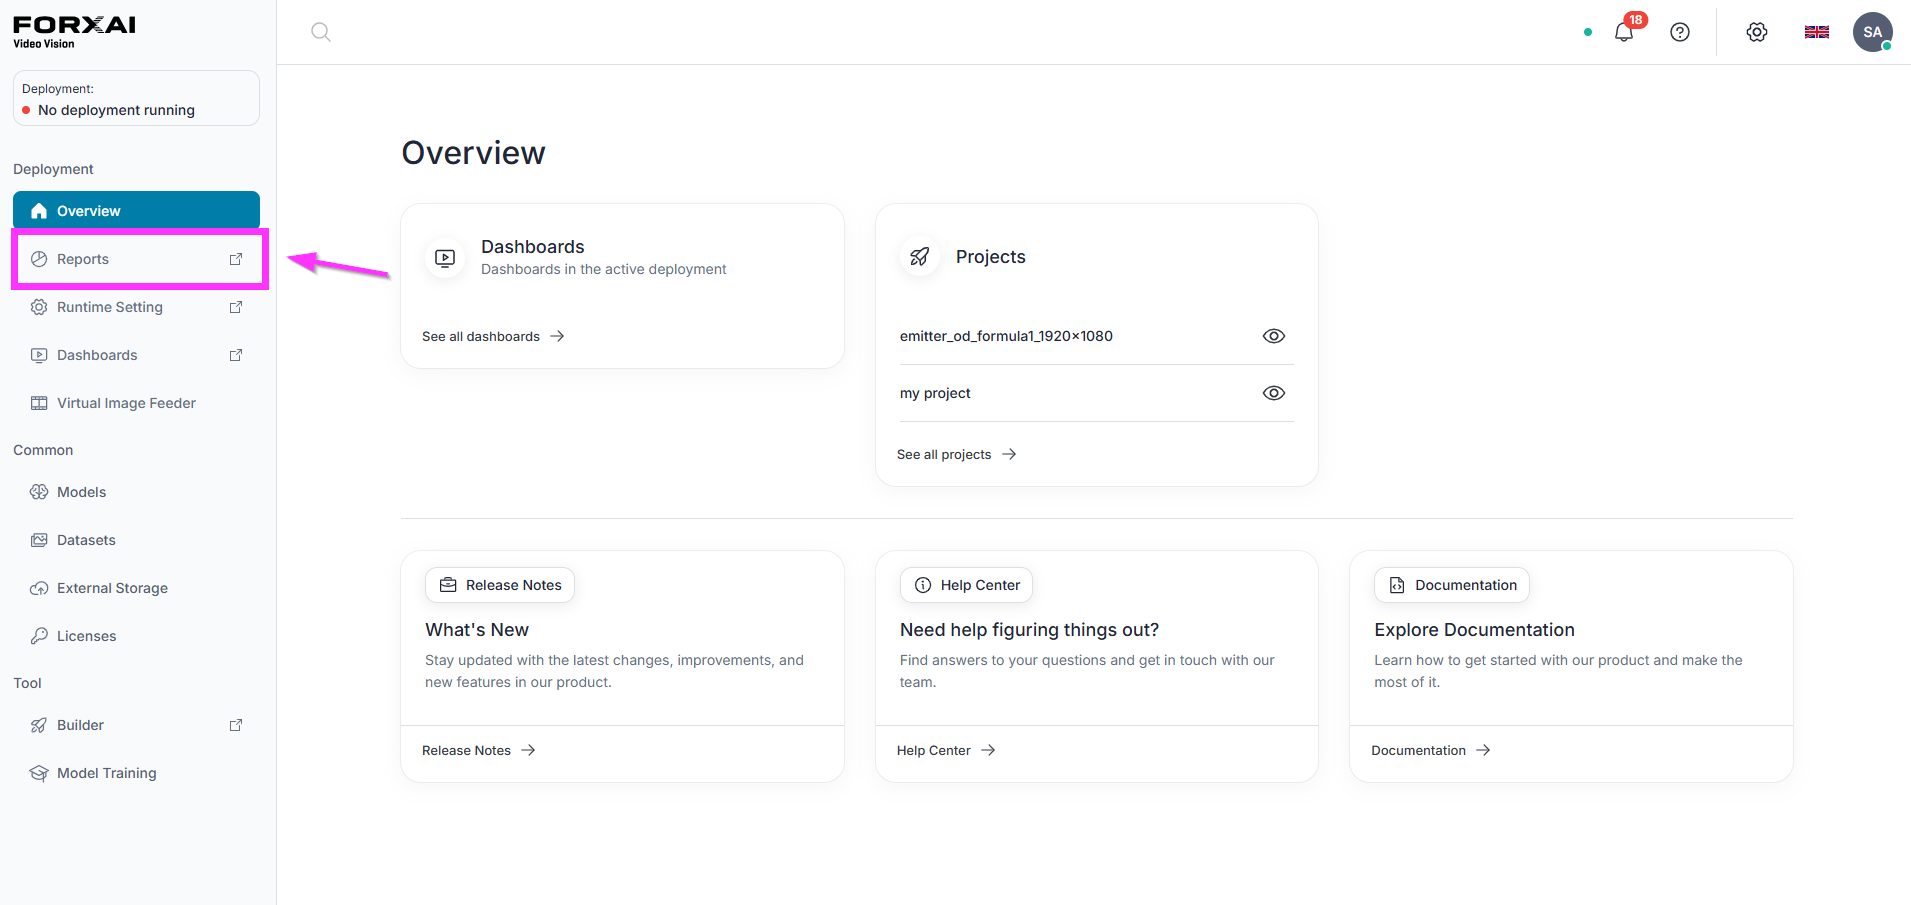
You can access Reports on the homepage by clicking the Reports tile.
Reporting overview
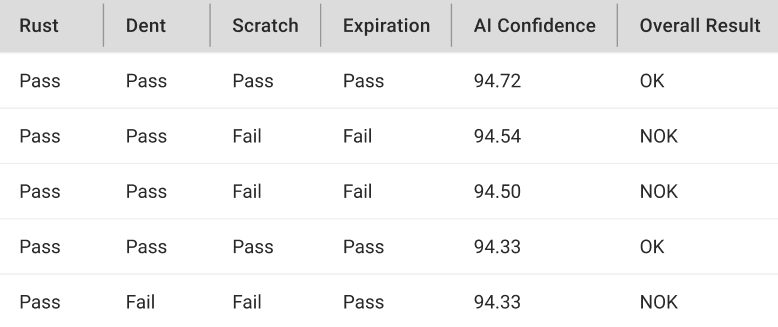
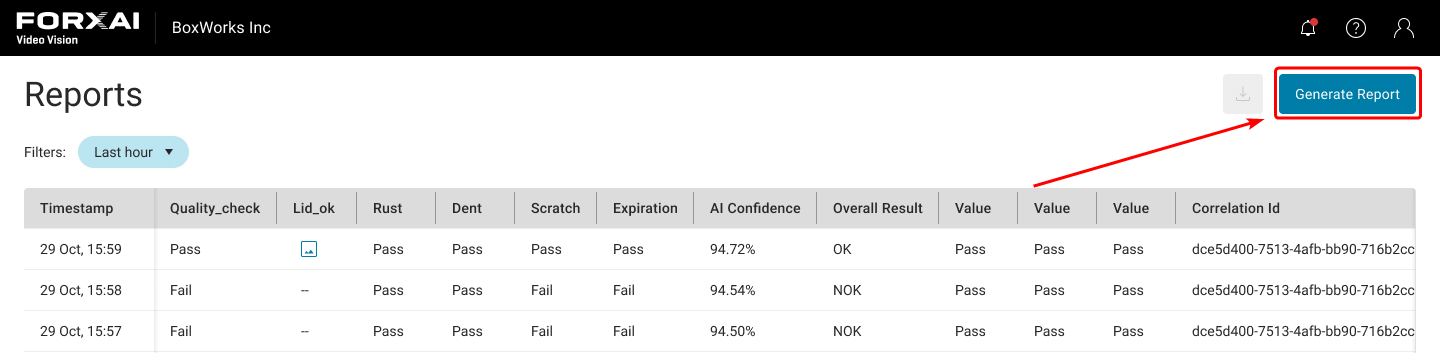
The Reporting overview displays the most recent detections and detailed data collected from the configured flows.
The Reporting overview displays detailed records of detections, including columns such as defect types, AI confidence scores, and overall inspection results. This data helps you quickly review and analyze detection performance.
Most columns in the Report correspond directly to the outputs from the configured flow. Additional columns provide supplementary details:
Timestamp - Displays the exact time when the data was stored in the Reporting system.
Correlation ID - A unique identifier assigned for each detection, used to trace and link related events or outputs within the system. For example, if a detection goes through multiple processing steps (e.g., image analysis, defect detection), the Correlation ID ensures that all those steps can be linked back to the same detection event.
💡 Tip
In case of any issues, the Correlation ID can be shared with support to assist in identifying and resolving the problem.
Reporting limitations
To ensure optimal performance and system stability, the Reporting interface has a display limit.
Record Limit - The Reporting table can display a maximum of 10,000 records for any chosen time window.
Recent Data Prioritization - If your selected time range contains more than 10,000 records, only the 10,000 most recent entries will be shown.
The message you will see when you hit the limit:
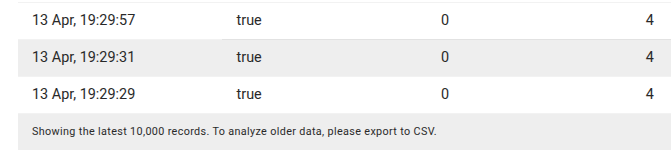
⚠️ If you need to analyze data that exceeds this limit or access older records within a high-volume time window, you must generate and export CSV report.
Preview and Download images
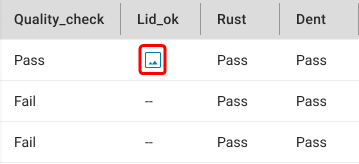
You can preview individual images by clicking the image icon. Once the preview is opened, you can download the image.
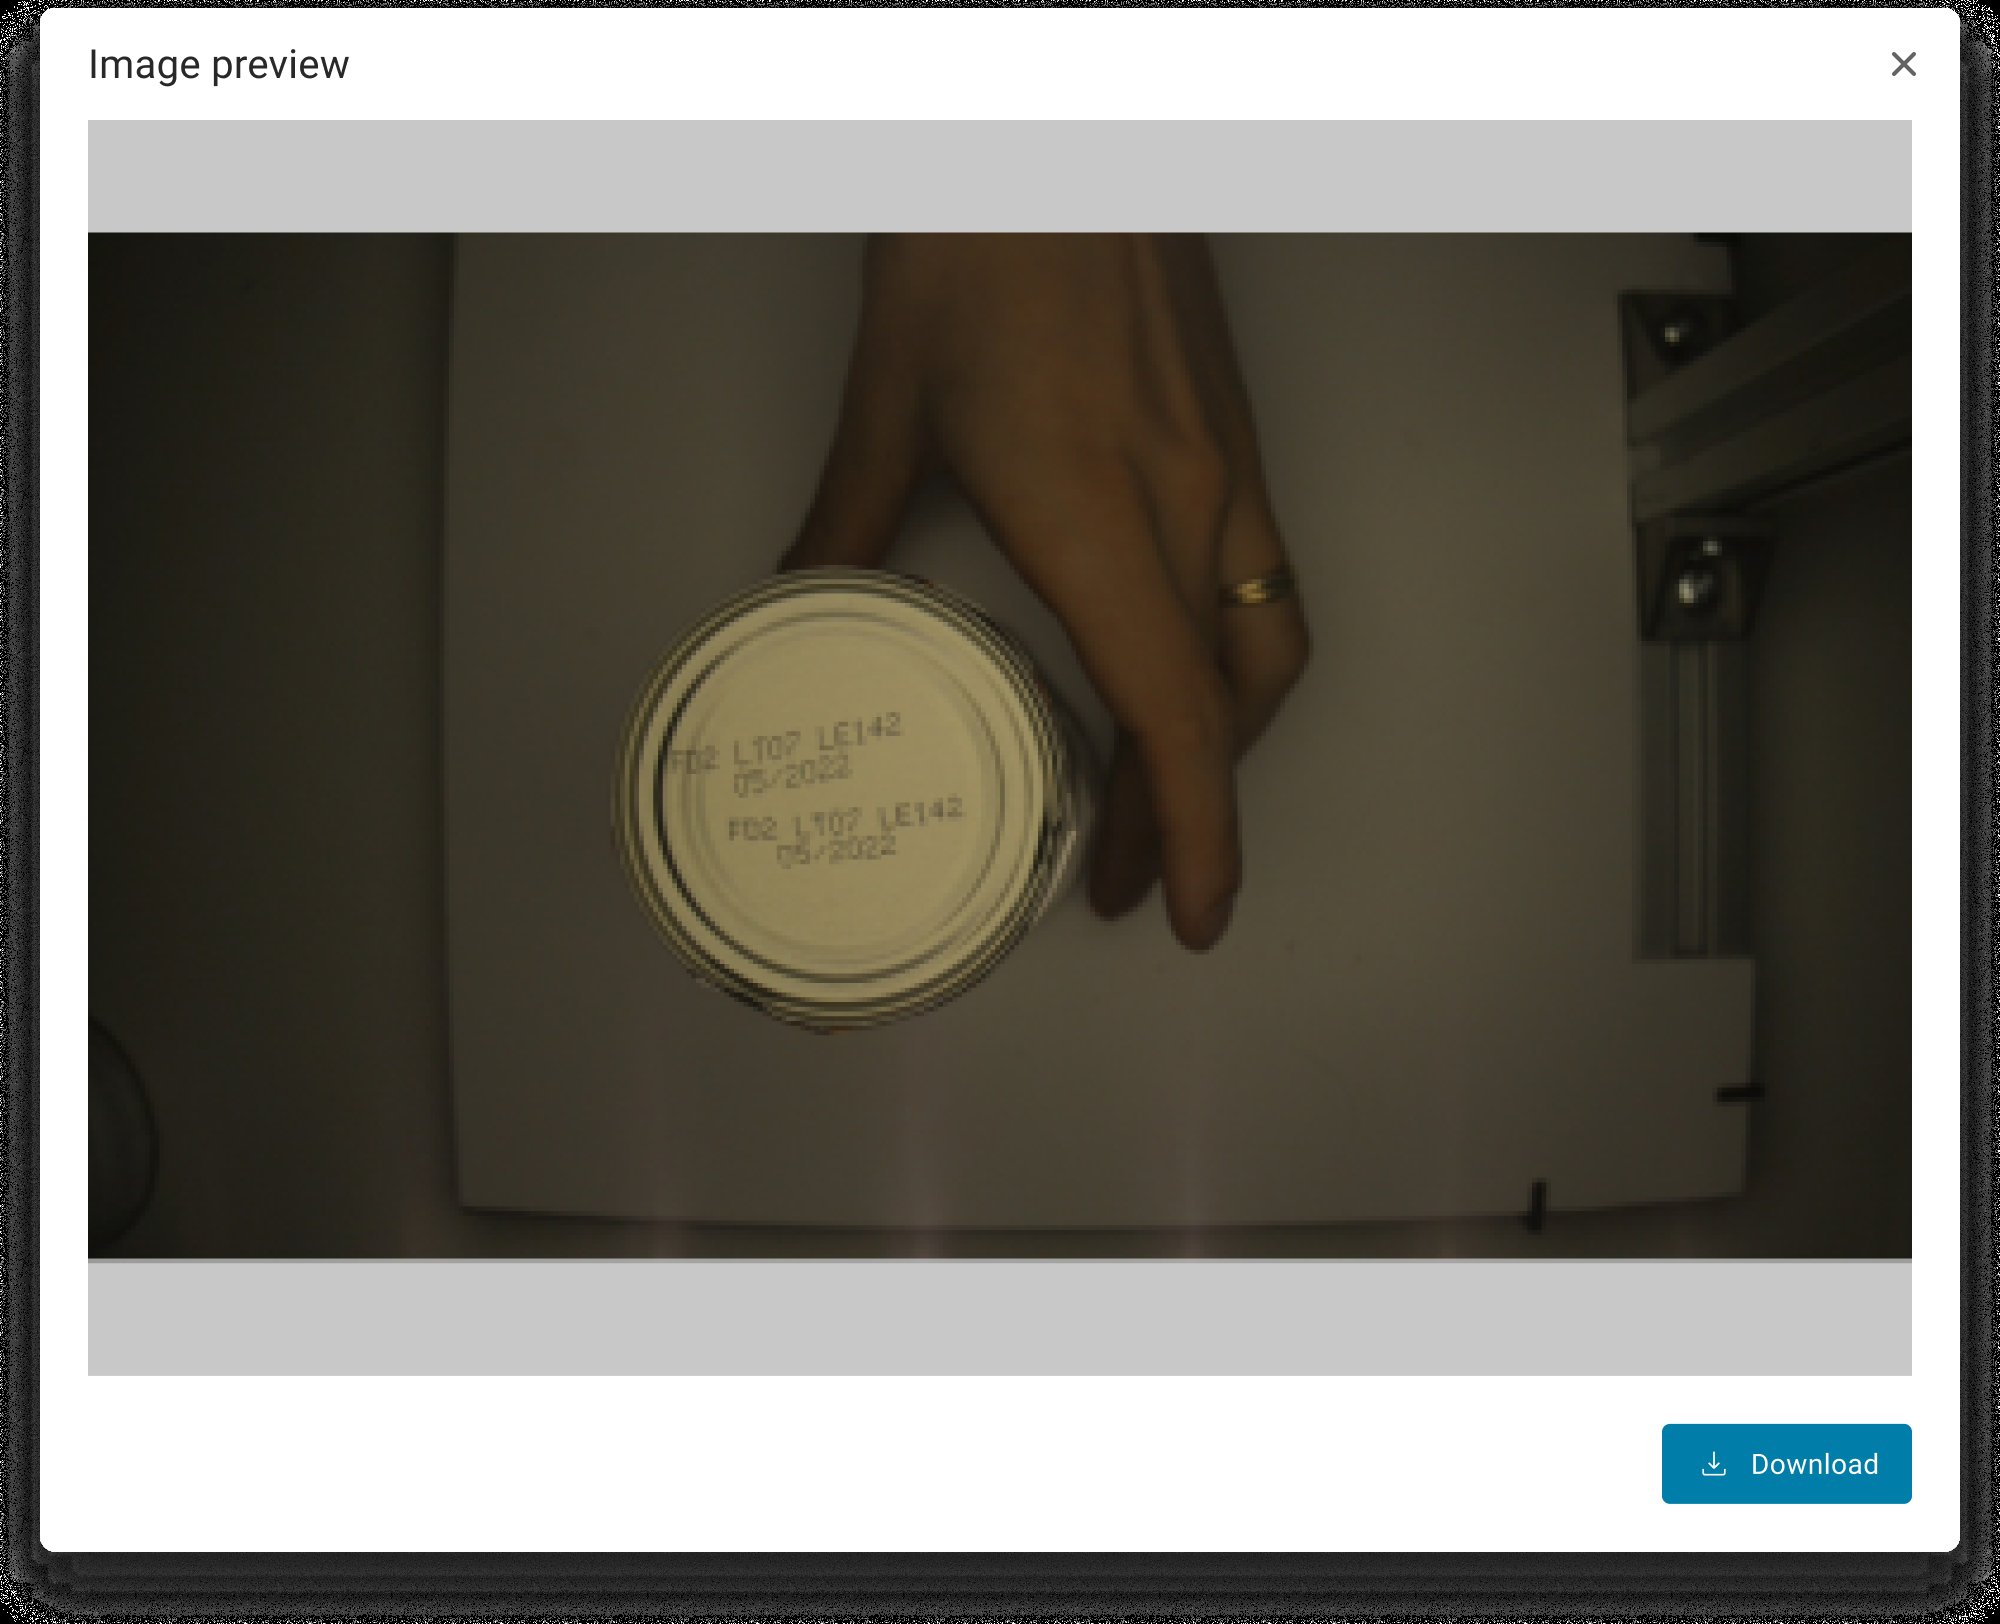
💡 Tip
Image preview is used to download single images. To download all images, generate a full report.
Generate a report
⚠️ Warning
All generated reports expire after 24 hours. You will not be able to upload them after that.
Reports can be generated and exported in two ways:
- Downloaded directly as a CSV file (optionally including images)
- Sent to a configured external storage server
Report generation
💡 Tip
Generated report contains all stored reports that were not removed by retention. At the moment there is no filtering for report generation.
To generate and export a report, follow these steps:
Go to the HUB.
Click the Reports in menu.
- Click the Generate Report button.
(Optional) To include images in the generated report, select the Include images checkbox.
Click Generate.
⚠️ Warning
Report generation can impact the performance of the application. For optimal results, perform this task outside production hours.
Wait for the report to be generated. This can take several minutes.
Once the report is generated you will see tooltip that report is ready.
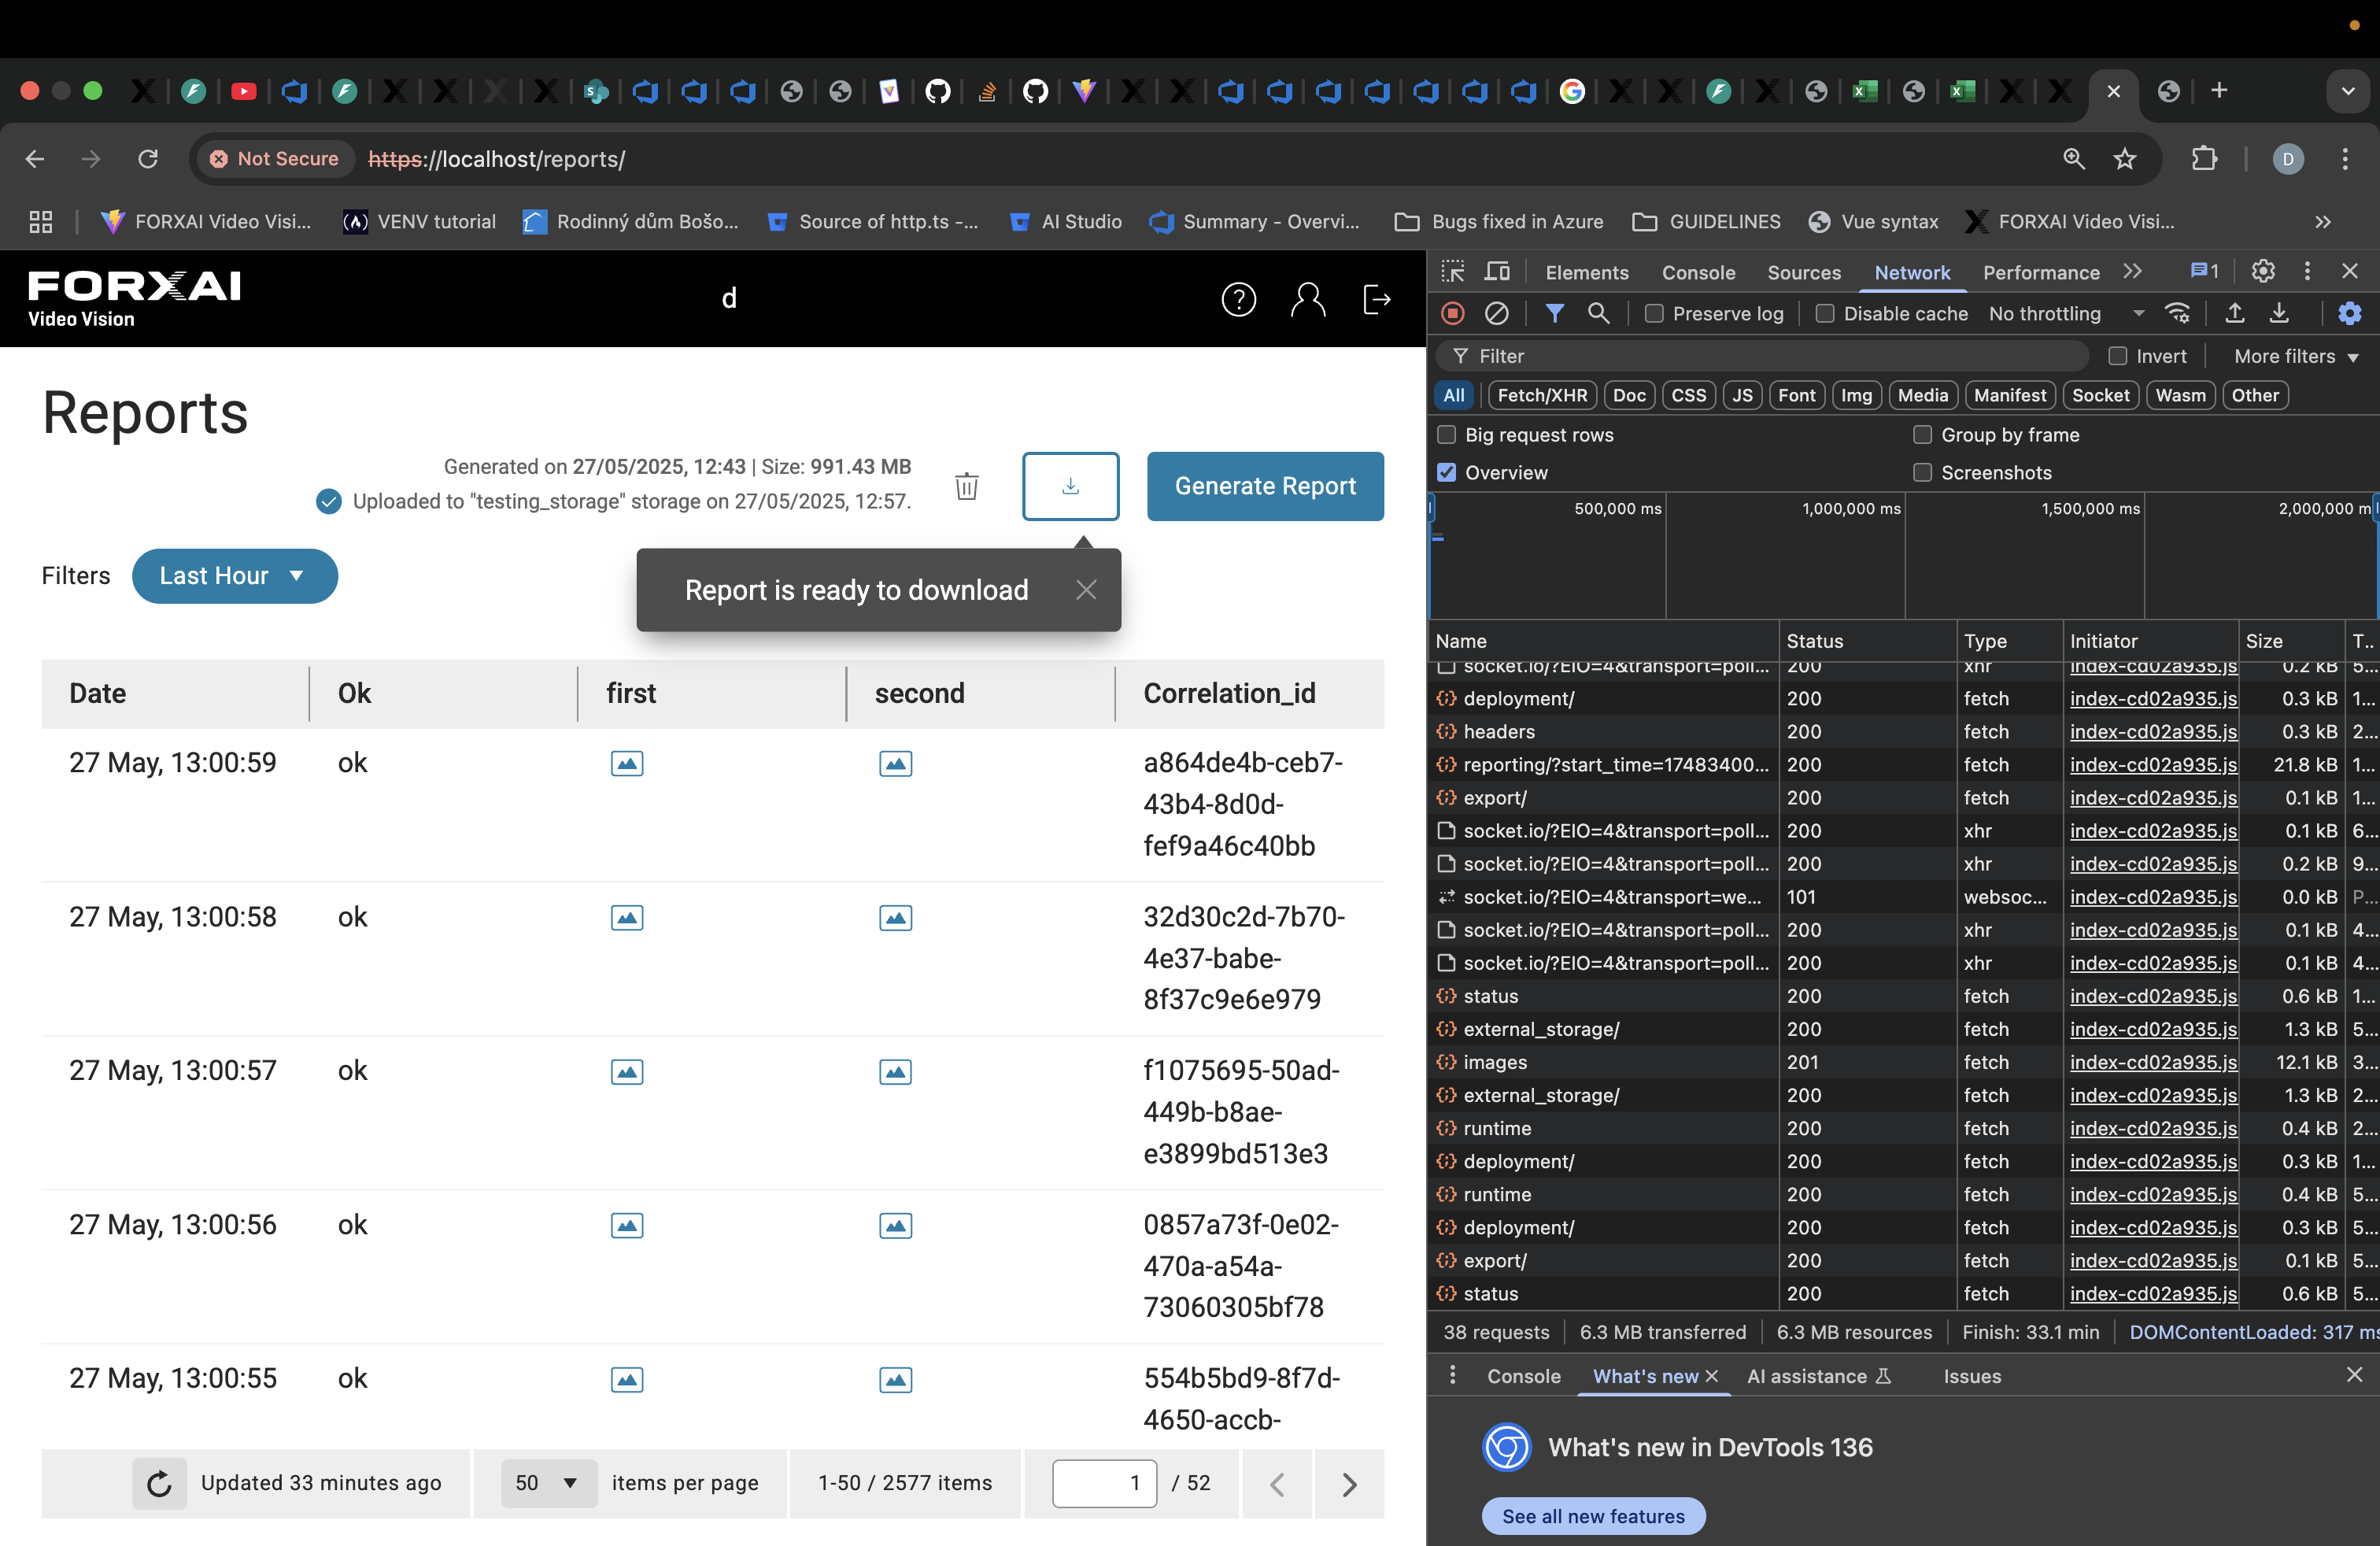
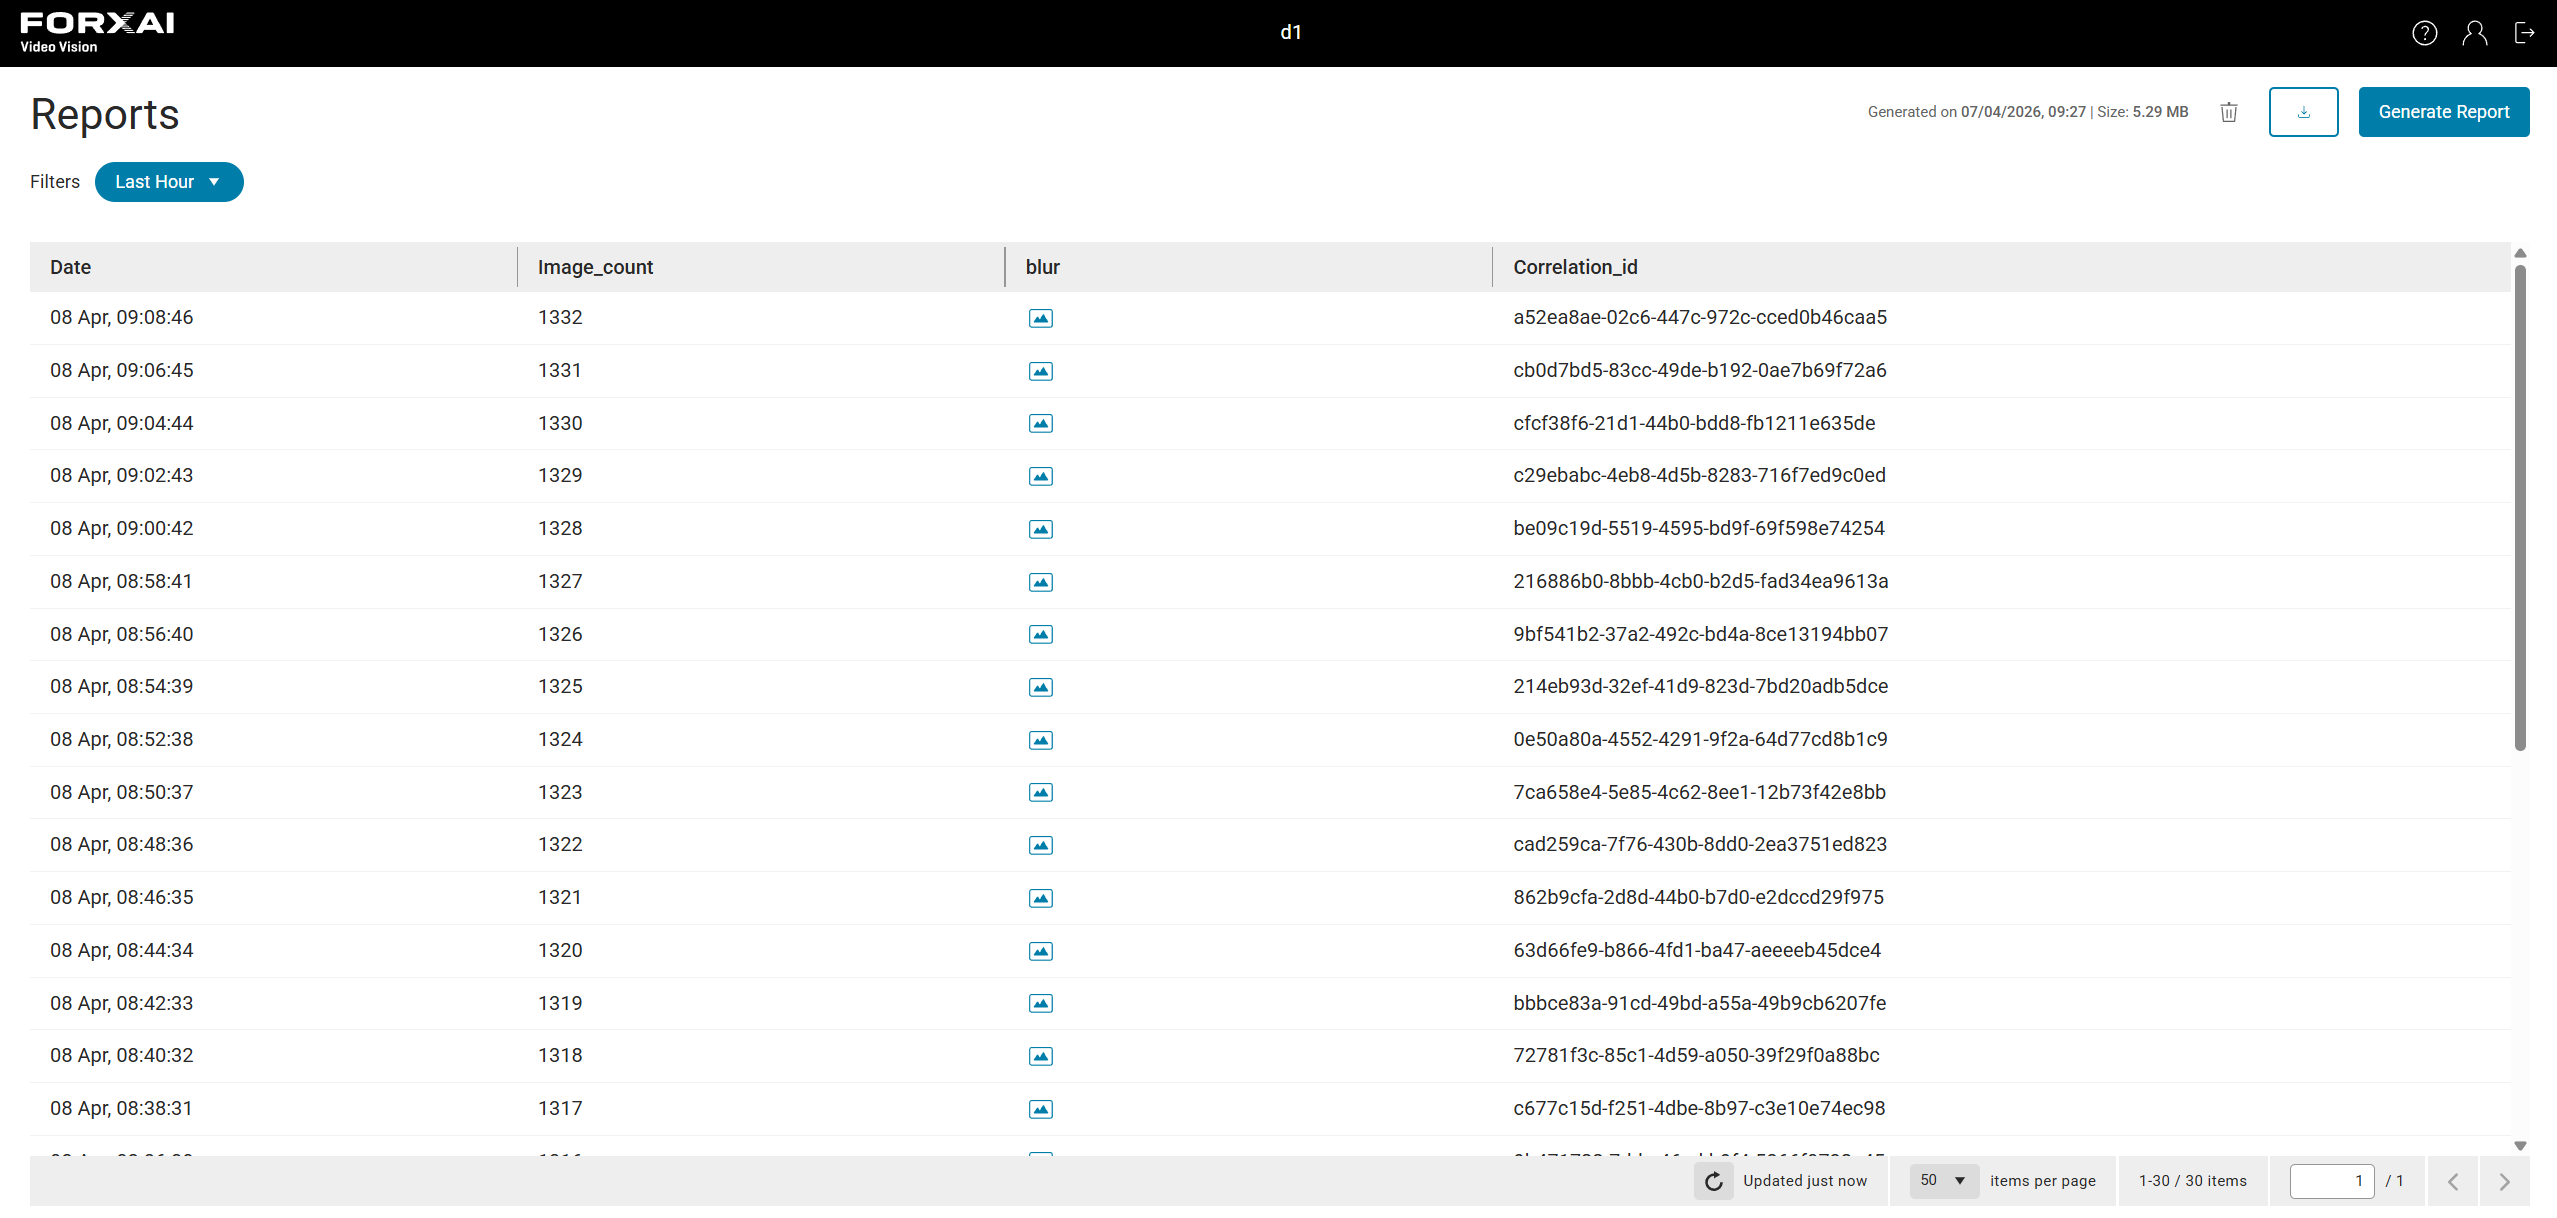
- For downloading or exporting report click on this button:
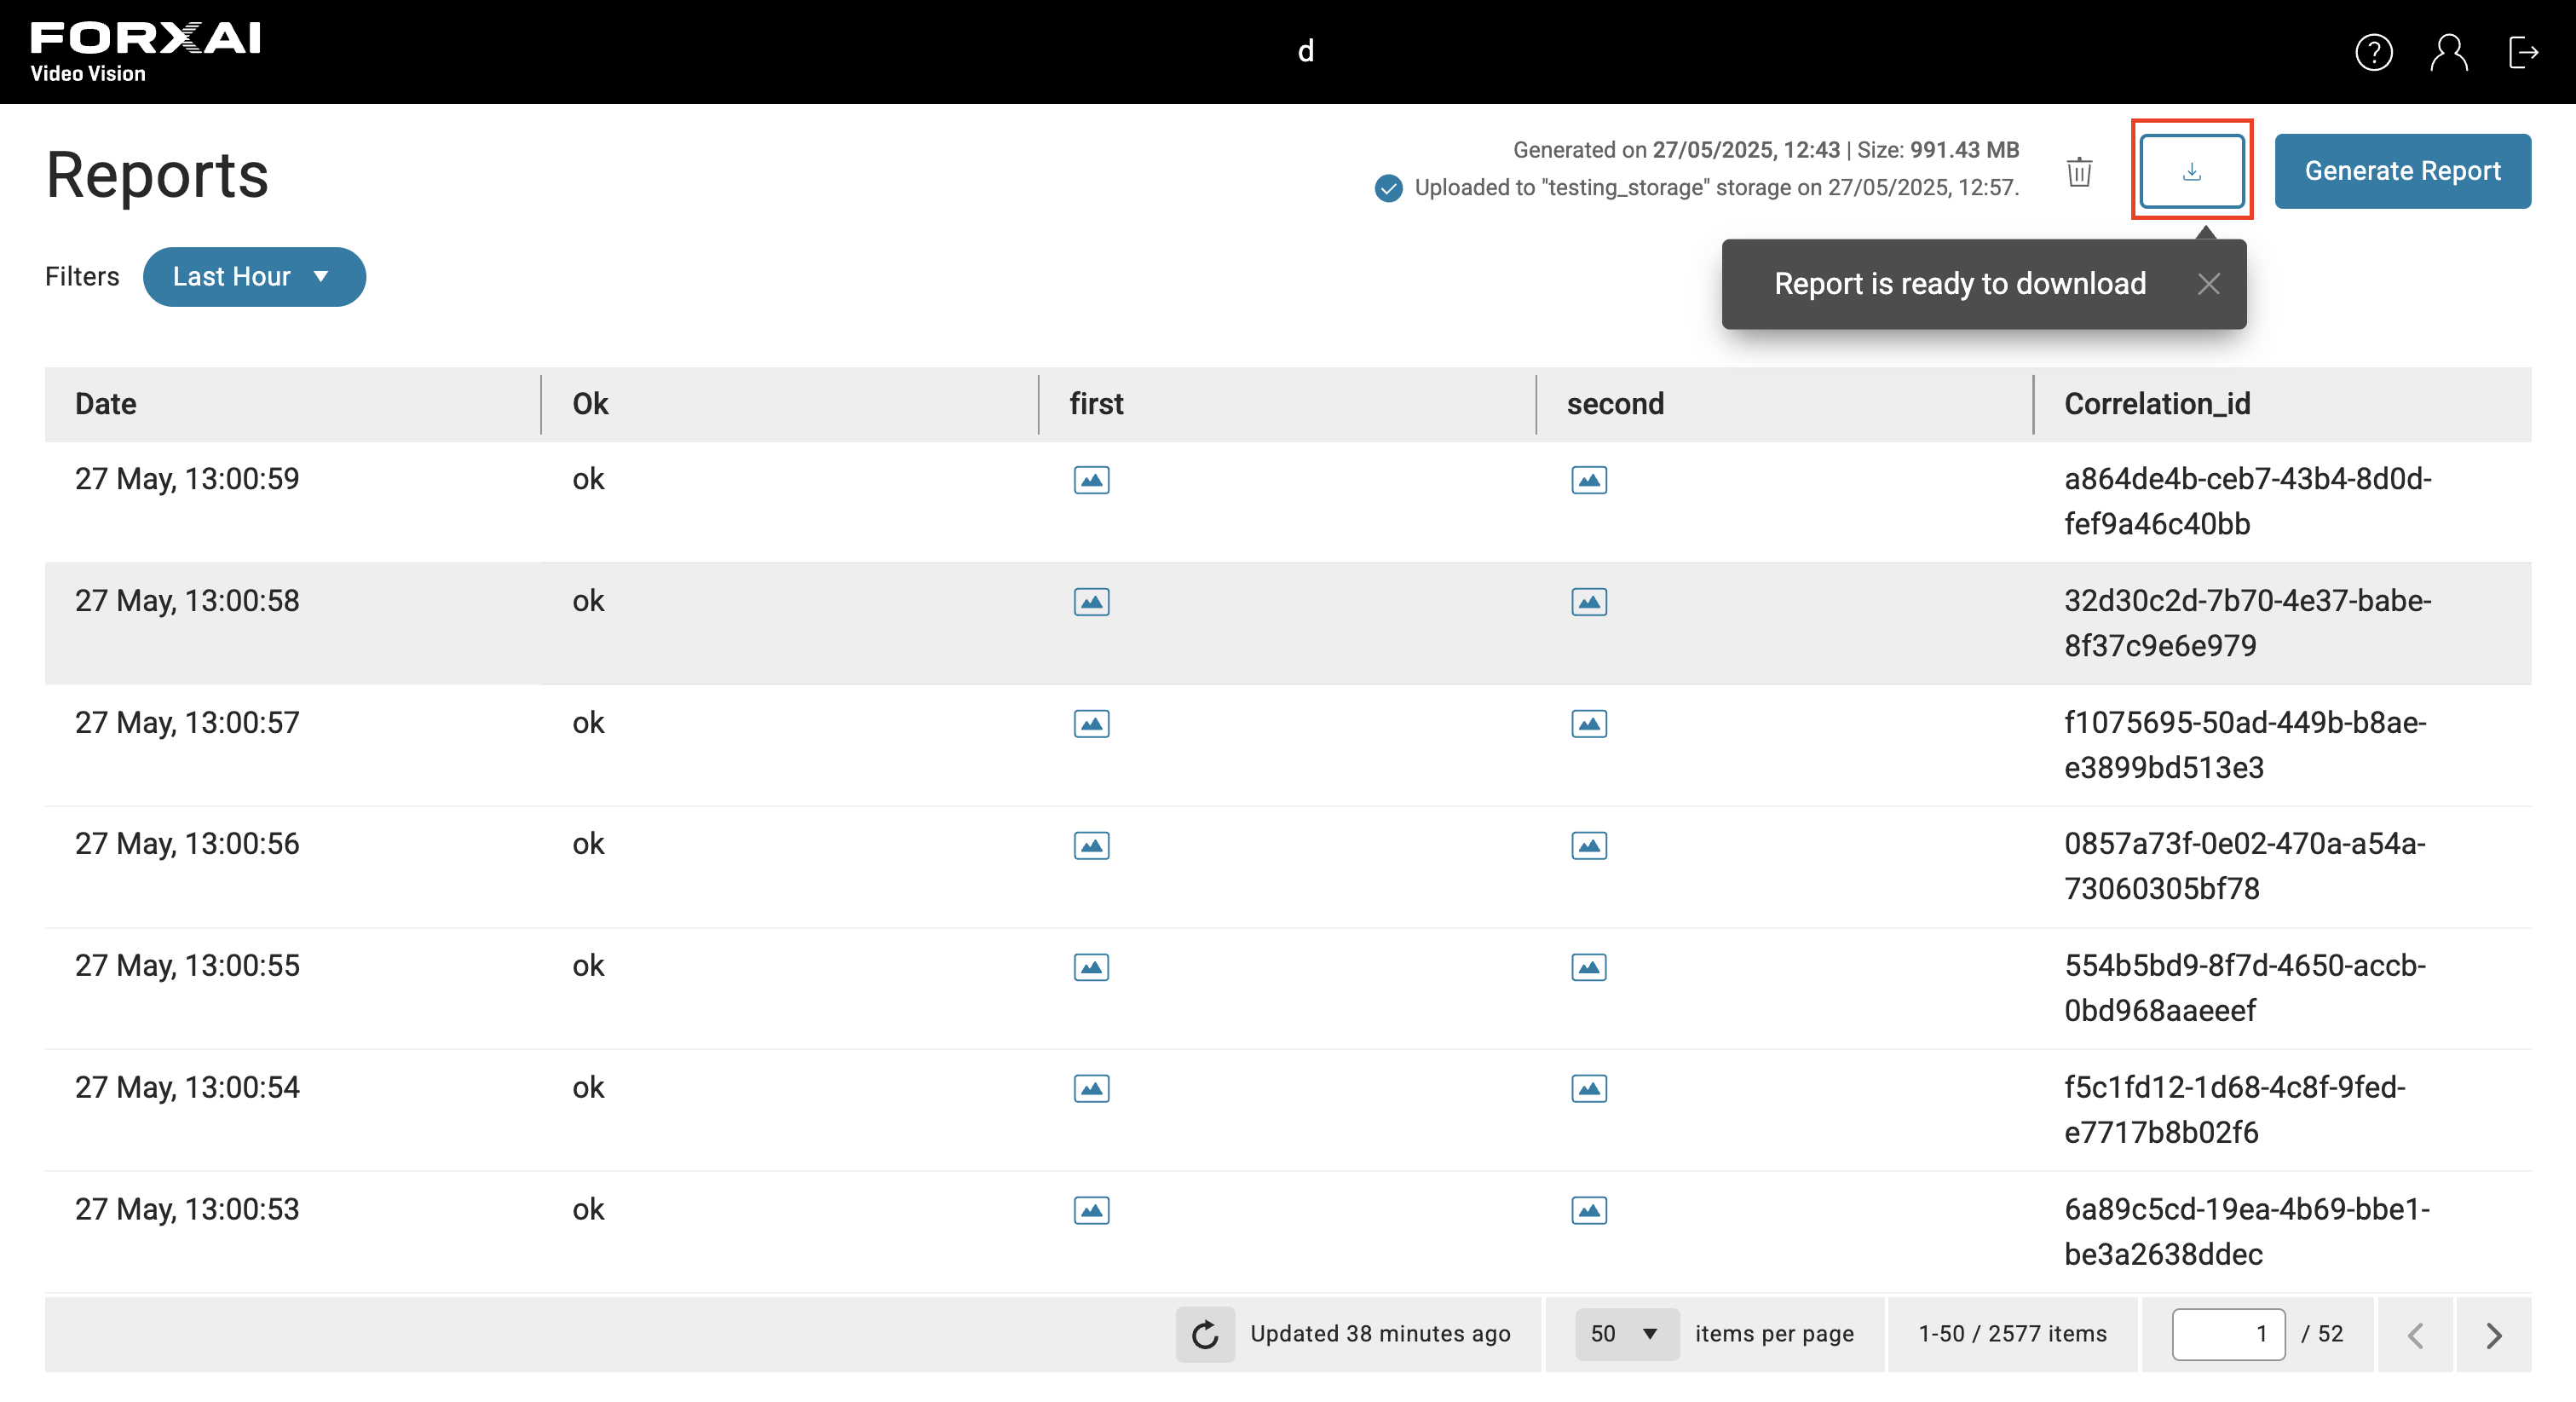
- In the tooltip you will see two actions:
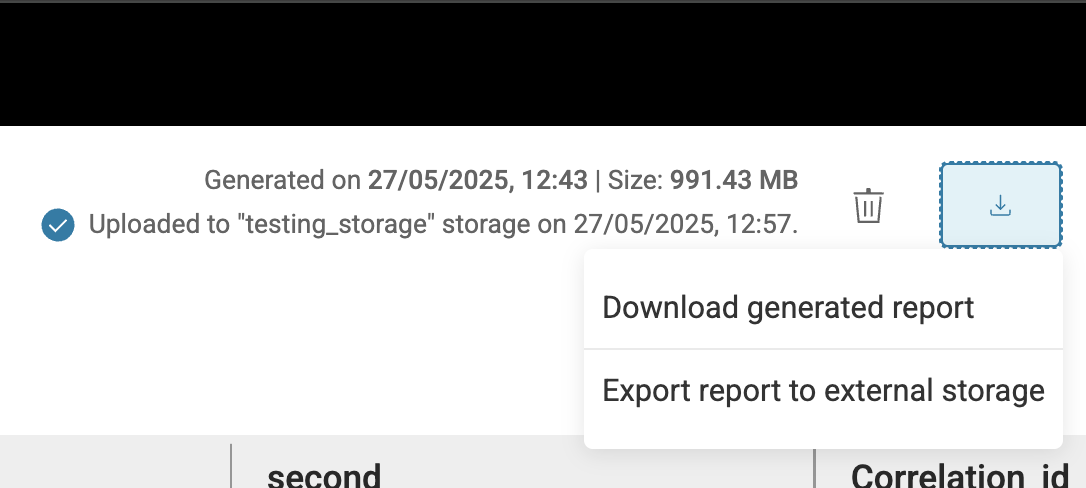
Download the report to the local storage
- When report is prepared click Download generated report button
- A ZIP file will be downloaded
Export the report to External storage
⚠️ Warning
Do not stop and reset the deployment when uploading of report is in progress.
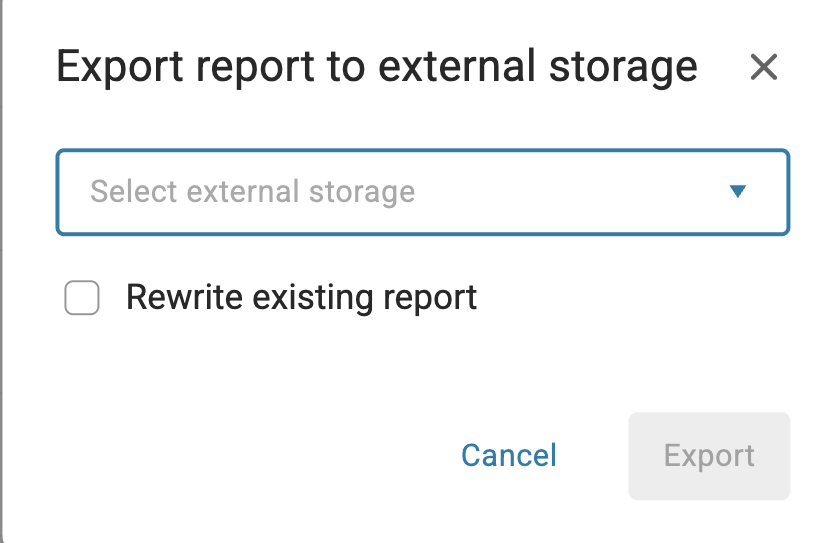
When report is prepared click Export report to external storage
In the dialog:
a. Select external storage (pre-configured on the External Storages page)
b. (Optional) Rewrite existing report - it'll rewrite already existing file. If you don't choose this option and file is already generated, you'll get an error.
💡 Tip
Use this option to overwrite a corrupted file (error happened during uploading) in storage — for example, when an interrupted upload leaves a corrupted file you cannot remove directly through the storage interface.
c. Click export button -> runs file upload. The dialog closes, if the connection is established and no error happened (see possible errors). At the end you'll receive appropriate notification, when upload is finished.
⚠️ Warning
When report export is running the user is prevented from report deletion or new report generation.
Possible errors
- Connection refused or timeout
- File already exists (if rewrite is not checked)
- Upload already in progress
- Permission denied
- Path does not exist
- Unexpected error - in this case the issue might be not enough space on the SFTP server
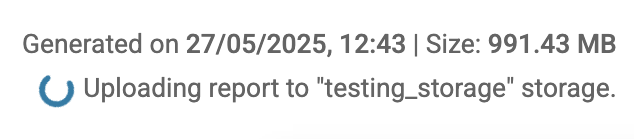
If upload doesn't start successfully, a message will confirm it.
The error may happen during running upload, in this case you'll receive notification, that upload failed and the message will be shown.
⚠️ Warning
Only one export to external storage can run at a time.
When the upload is complete:
