
Appearance
 Table Statistics
Table StatisticsOverview
Aggregates numerical data and calculates running statistics — sum, average, minimum, or maximum. It accumulates values across frames and outputs the results as two tables.
Table Statistics operates in one of two input modes depending on configuration:
- Generic mode (default): receives a text label on the
classificationinput and a number on thevalueinput. Each unique label becomes a row in the output tables. - Pre-specified mode: when input names are listed in the Pre-specified inputs parameter, the node creates one numbered input port per name. No separate classification input is required, the port name itself serves as the row label.
Use Table Statistics when:
- Tracking the total number of parts processed in a shift.
- Calculating the average rate of defective items during quality control.
- Monitoring minimum and maximum temperature readings from a sensor.
💡 Tip
Use the occurrences output to track how many data points have been collected for each input category.
Inputs
The available inputs depend on whether Pre-specified inputs is configured.
Generic mode (Pre-specified inputs is empty)
| Name | Type | Description |
|---|---|---|
| classification | string | The label identifying the data category. |
| value | number | The numerical value to aggregate. |
| reset | any | Resets all accumulated values and counts to zero. |
Pre-specified mode
| Name | Type | Description |
|---|---|---|
| [input_name] | number | One port per comma-separated name in the configuration. |
| reset | any | Resets all accumulated values and counts to zero. |
Outputs
| Name | Type | Description |
|---|---|---|
| statistics | table | A table containing the calculated statistical values for each input. |
| occurrences | table | A table containing the count of values received per input. |
Both tables use Classification as the first column. The second column depends on the table:
| Table | Statistics method | Column header |
|---|---|---|
| statistics | sum | Σ(X) |
| statistics | average | Φ(X) |
| statistics | min | min(X) |
| statistics | max | max(X) |
| occurrences | (all) | # seen |
Parameters
| Parameter | Default | Valid values | Tunable |
|---|---|---|---|
| Statistics method | sum | sum, average, min, max | ❌ |
| Pre-specified inputs | string (comma-separated list) | ❌ | |
| Enable automatic state reset | false | boolean | ❌ |
Statistics method
Determines the aggregation function applied to incoming data:
- sum — running total of all received values.
- average — incremental mean, updated with each new value.
- min — smallest value seen so far.
- max — largest value seen so far.
Pre-specified inputs
A comma-separated list of input names. When set, the node creates one number input port for each name instead of the generic classification + value pair.
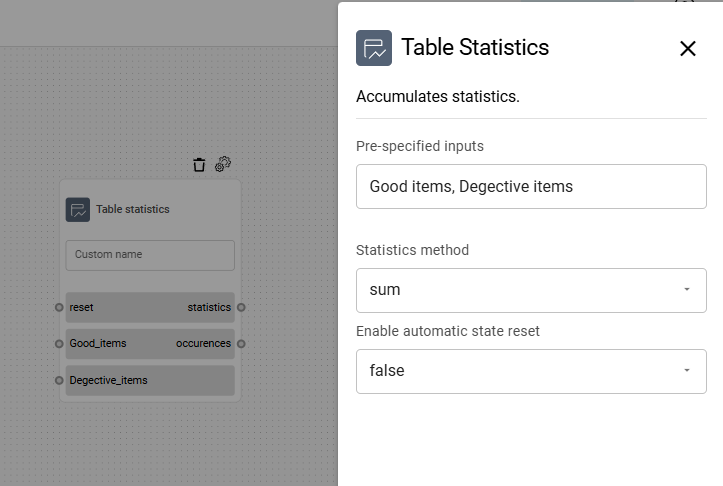
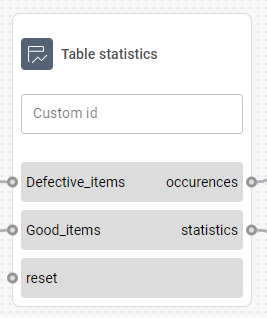
Input names are normalized internally: spaces become underscores, non-alphanumeric characters are removed, and consecutive underscores are collapsed.
Enable automatic state reset
When enabled, the node automatically resets its accumulated state.
Example
Production tracking
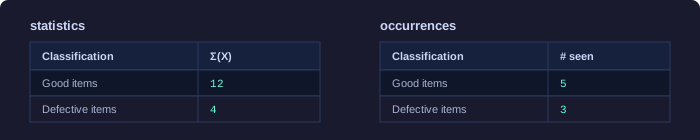
Track the sum of "Good" and "Defective" items across an inspection shift.
Configuration:
- Statistics method:
sum - Pre-specified inputs:
Good items, Defective items
After receiving 5 signals on "Good items" (values: 3, 1, 2, 4, 2) and 3 on "Defective items" (values: 1, 2, 1):
Related links
Reference:
- Table — for displaying aggregated tables
- Accumulator — for simpler value accumulation