Appearance
Evaluation
In the Evaluation Config, the user selects a primary metric along with any additional evaluation metrics. The primary metric determines the best model, while the additional metrics are plotted for performance analysis.
Available metrics:
- Object Detection (OD):
mAP50,mAP75,mAP90 - Anomaly Detection (AD):
AUROC,F1Max - Loss function: plotted for additional insight
Quick notes:
- Most metrics range from 0 to 1, with higher values indicating better performance.
- Validation metrics (
val) measure performance on unseen data. - Loss is used internally for model optimization:
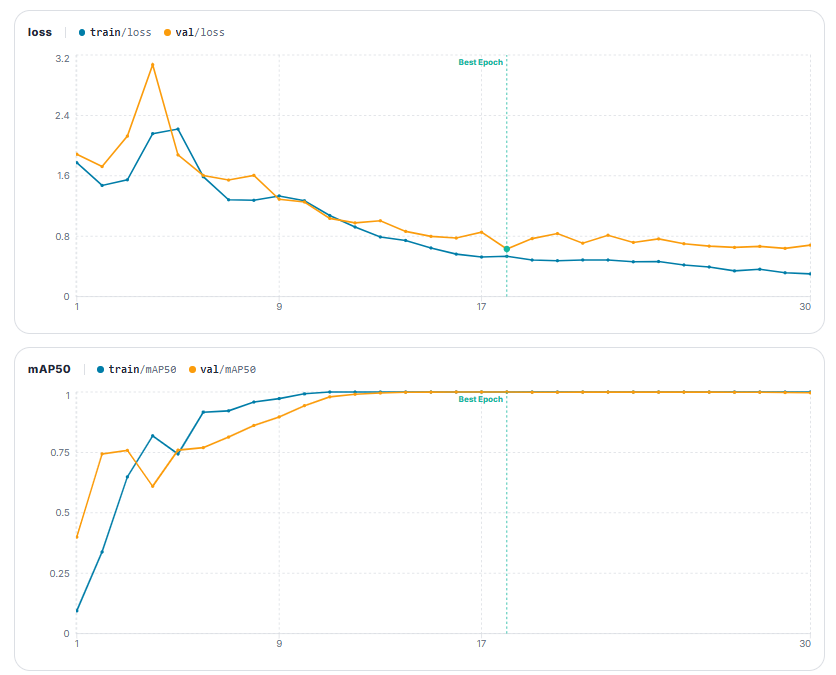
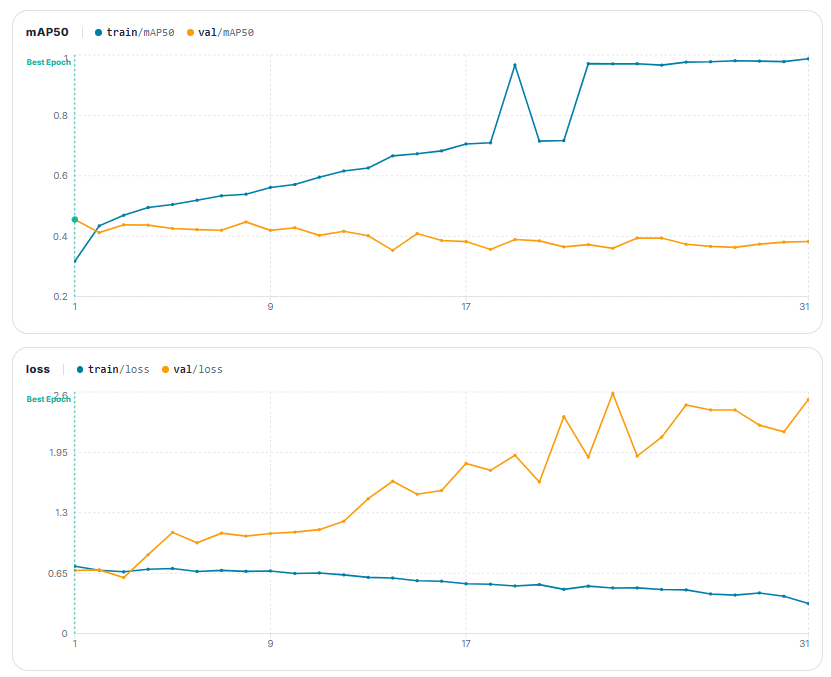
train/lossshows how the model learns during training.val/lossgives a sense of generalization to new data.
- During training, loss generally decreases. Absolute values depend on the problem type:
- OD losses typically approach 0.
- AD losses can be negative and vary in scale.
⚠️ For Anomaly Detection the loss cannot be selected as a metric.
That's because PatchCore does not compute it. For FastFlow, the training loss is always plotted but cannot be selected as the main metric.
Good training example
Bad training example
Object Detection (OD) Metrics
Metrics: train, val: mAP50, mAP75, mAP90, loss
- mAP (Mean Average Precisioƒn): measures how well predicted bounding boxes match ground-truth boxes across all classes. The numeric suffix specifies the minimum required overlap percentage between predicted and ground-truth bounding boxes (IoU): 50 = least strict, 90 = most strict. Lower-threshold mAP is always greater or equal than higher-threshold mAP for the same model.
- Loss: quantifies how much is a model close to the training objective during training. For detection models, it is typically a combination of localization and classification errors rather than a single measure of prediction quality.
train/lossreflects fit on the training set, andval/lossreflects generalization to the validation set. Lower is usually better, though absolute values are not directly comparable across tasks or architectures.
Anomaly Detection (AD) Metrics
Metrics: val: AUROC, F1Max; train: loss
- AUROC (Area Under the Receiver Operating Characteristic curve): measures the model's ability to distinguish the anomalous samples from the normal samples across all possible classification thresholds. A higher AUROC indicates better class separability, with
1.0representing perfect separability and0.5corresponding to random guessing. - F1Max: maximum F1 score across thresholds. Useful when both missed anomalies and false alerts matter, and you want a single operating point that balances them. Note: in real-world use, you’ll need to choose the threshold yourself to reach this score.
- Loss: measures how well the model fits the training data. PatchCore does not compute a loss (non-iterative method), while FastFlow computes it only during training (
train/loss). Lower values indicate better fit, but are not directly comparable across methods.
Both AUROC and F1Max are computed only on the validation set, as the training set contains only normal (OK) samples and is therefore unsuitable for assessing anomaly detection performance.