
Appearance
 Table
Table
Table⚠️ Warning
This output cannot be saved in reporting.
Overview
The Table node provides an exit point for structured data from the flow to the platform dashboard. It renders incoming data as a dynamic grid with clearly defined columns and rows, allowing for quick visualization of multi-record results.
Use Table when:
- You want to display multiple statistics or records in a structured grid.
- You need to output the final results from a data aggregation process.
💡 Tip
This node is typically used to display output from statistical aggregation nodes or data collection processes.
Inputs
| Name | Type | Description |
|---|---|---|
| value | table | A structured dataset containing named columns and typed rows for grid rendering. |
Parameters
This node does not have any configuration parameters.
Example
Displaying statistics of cars
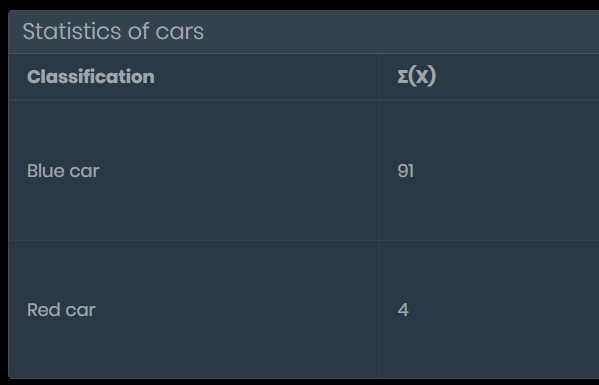
A flow counts cars with different colors during an inspection cycle. The aggregated results are sent to a Table node to show car colors and their corresponding counts on dhe dashboard.
Configuration:
- This node has no configurable parameters.
Result: A grid appears on the dashboard displaying columns like Classification and SUM, with rows for specific categories like Blue car or Red car.
Related links
Reference:
- Table Statistics — generates aggregated data tables